Fig. 3
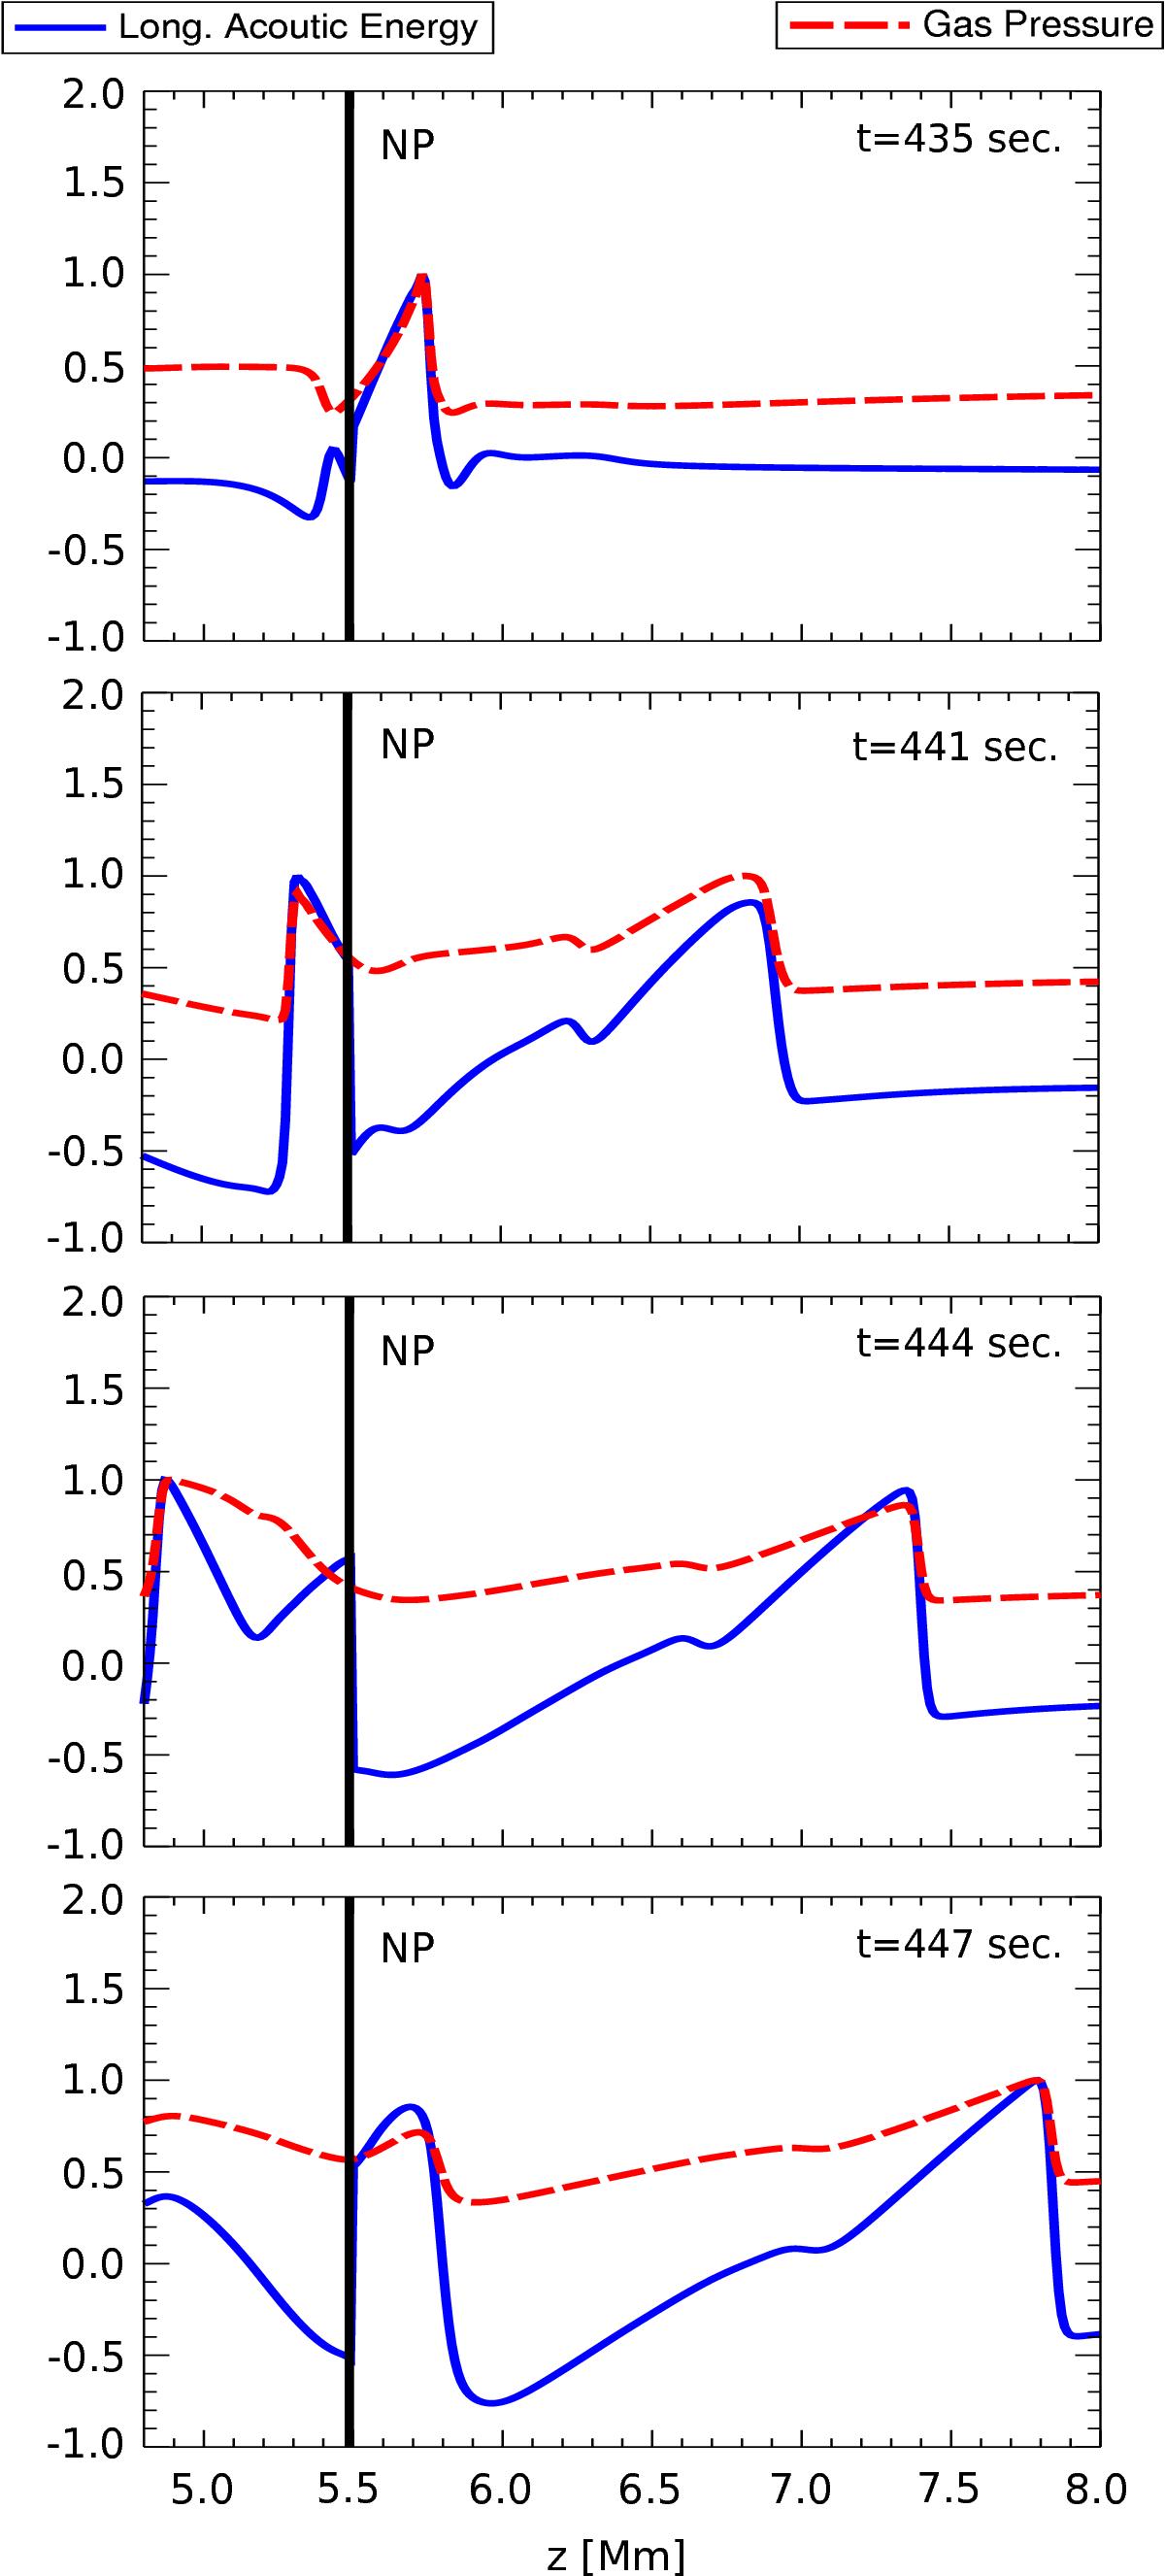
Vertical cuts at the location of the null point showing the time evolution (from top to bottom) of the acoustic energy flux proxy (blue) and total gas pressure fluctuations (red dashed line). Both variables have been normalized to their maximum values to better compare them. The vertical black line marks the location of the null point.
Current usage metrics show cumulative count of Article Views (full-text article views including HTML views, PDF and ePub downloads, according to the available data) and Abstracts Views on Vision4Press platform.
Data correspond to usage on the plateform after 2015. The current usage metrics is available 48-96 hours after online publication and is updated daily on week days.
Initial download of the metrics may take a while.