Fig. 2
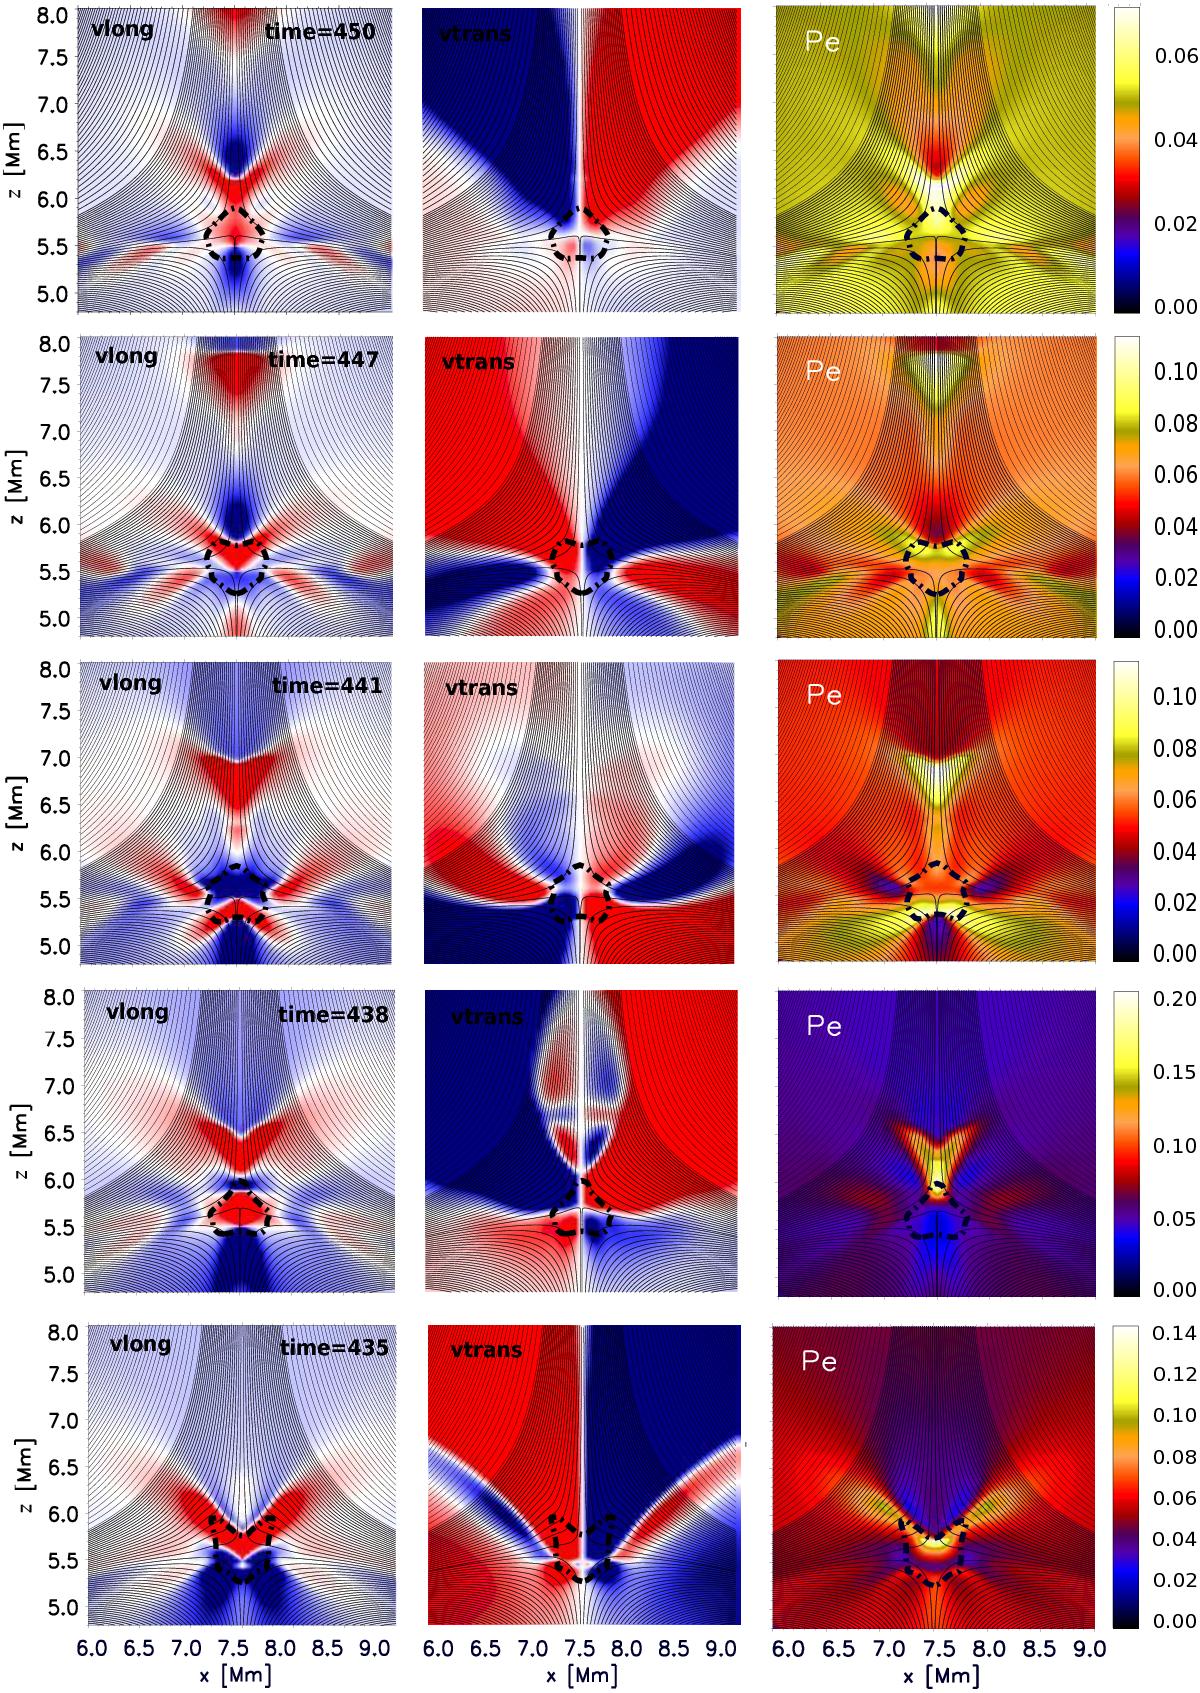
Longitudinal (left) and transverse (middle) velocities multiplied by ![]() and
and ![]() , respectively, in a region around the null point (a part of the simulation domain). The dashed closed curve is the contour where β = 1 and solid lines are magnetic field lines. Right: fluctuations of the total gas pressure, that is, the sum of the equilibrium and perturbed gas pressure, in the same region around the null point. Units are [dyn/cm2]. Time increases from bottom to top. For a better visualization, a movie of the propagation is available online.
, respectively, in a region around the null point (a part of the simulation domain). The dashed closed curve is the contour where β = 1 and solid lines are magnetic field lines. Right: fluctuations of the total gas pressure, that is, the sum of the equilibrium and perturbed gas pressure, in the same region around the null point. Units are [dyn/cm2]. Time increases from bottom to top. For a better visualization, a movie of the propagation is available online.
Current usage metrics show cumulative count of Article Views (full-text article views including HTML views, PDF and ePub downloads, according to the available data) and Abstracts Views on Vision4Press platform.
Data correspond to usage on the plateform after 2015. The current usage metrics is available 48-96 hours after online publication and is updated daily on week days.
Initial download of the metrics may take a while.