Fig. A.1
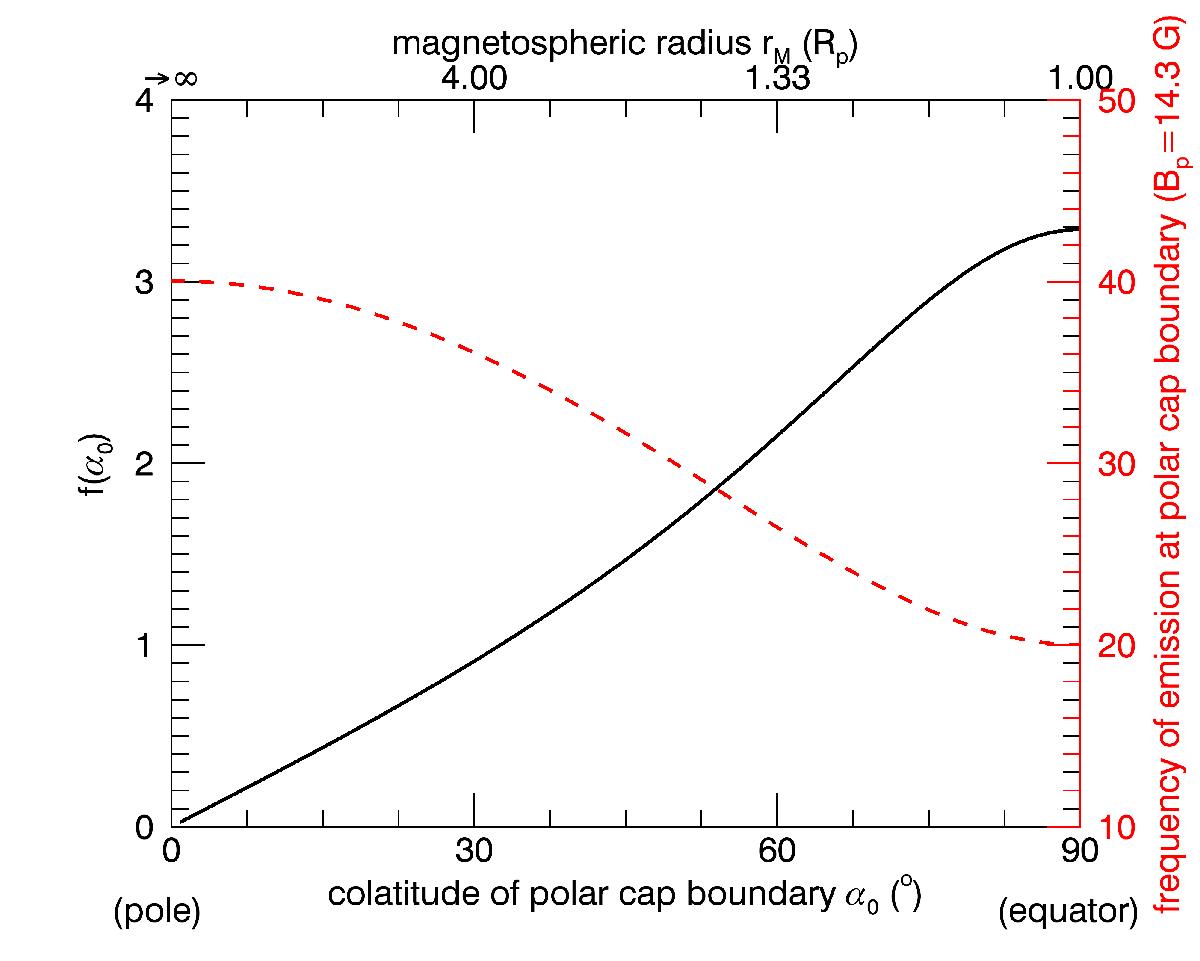
Black solid curve: variation of f (Eq. (A.12)) as a function of the planetary co-latitude of the polar-cap boundary α0. The top axis indicates the (non-linear) conversion from α0 to a normalised magnetospheric size following Eq. (A.1). Red dashed curve: the emission frequency at the polar-cap boundary (Eq. (A.3), right axis) for a magnetic field intensity at the pole of 14.3 G.
Current usage metrics show cumulative count of Article Views (full-text article views including HTML views, PDF and ePub downloads, according to the available data) and Abstracts Views on Vision4Press platform.
Data correspond to usage on the plateform after 2015. The current usage metrics is available 48-96 hours after online publication and is updated daily on week days.
Initial download of the metrics may take a while.