Fig. 6
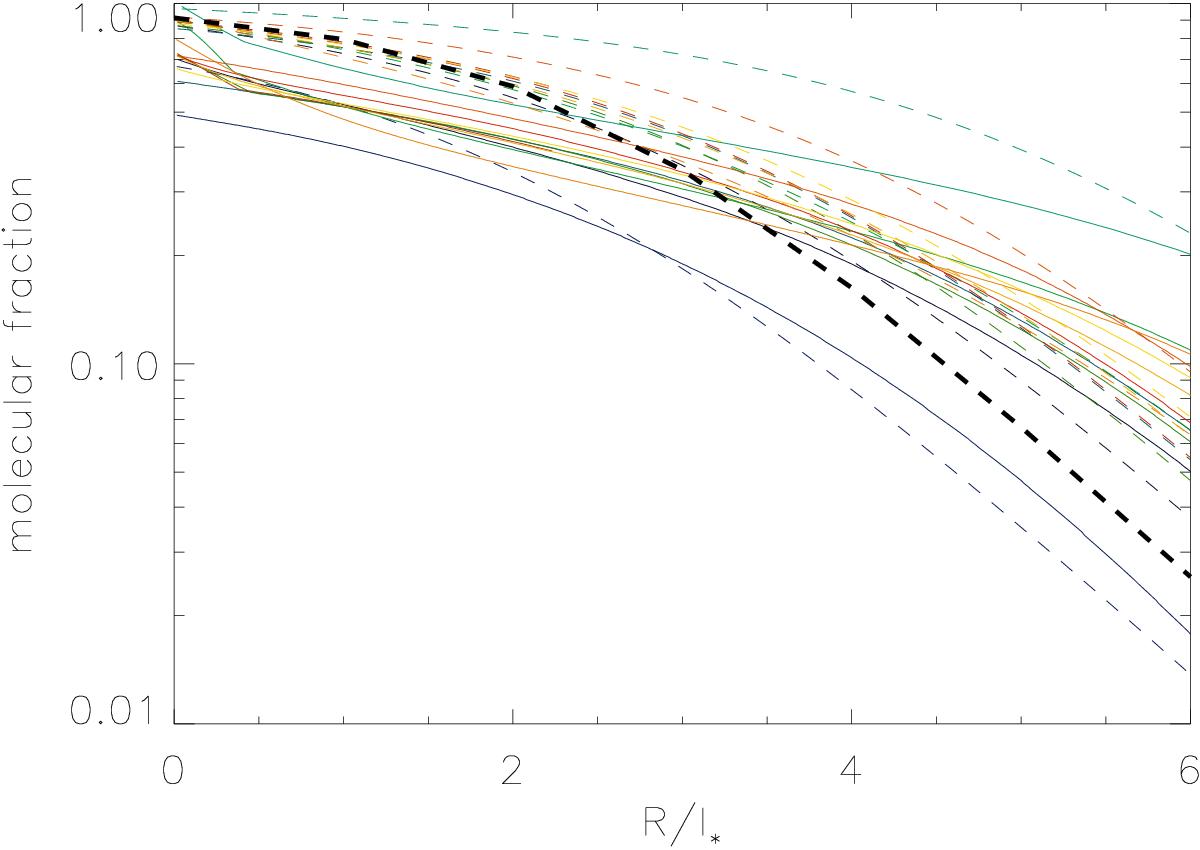
Radial profiles of the molecular fraction fmol for the local spiral galaxies. The solid line shows this model and the dashed line shows fmol = tff/tmol/(1 + tff/tmol), where the free-fall and molecule-formation times are those of self-gravitating clouds (Vollmer & Leroy 2011). The profile for each galaxy is shown in a different color. The observed relation Rmol = 10.6exp(−R/ 0.21R25) (Leroy et al. 2008) is shown as a thick dashed line.
Current usage metrics show cumulative count of Article Views (full-text article views including HTML views, PDF and ePub downloads, according to the available data) and Abstracts Views on Vision4Press platform.
Data correspond to usage on the plateform after 2015. The current usage metrics is available 48-96 hours after online publication and is updated daily on week days.
Initial download of the metrics may take a while.