Fig. 32
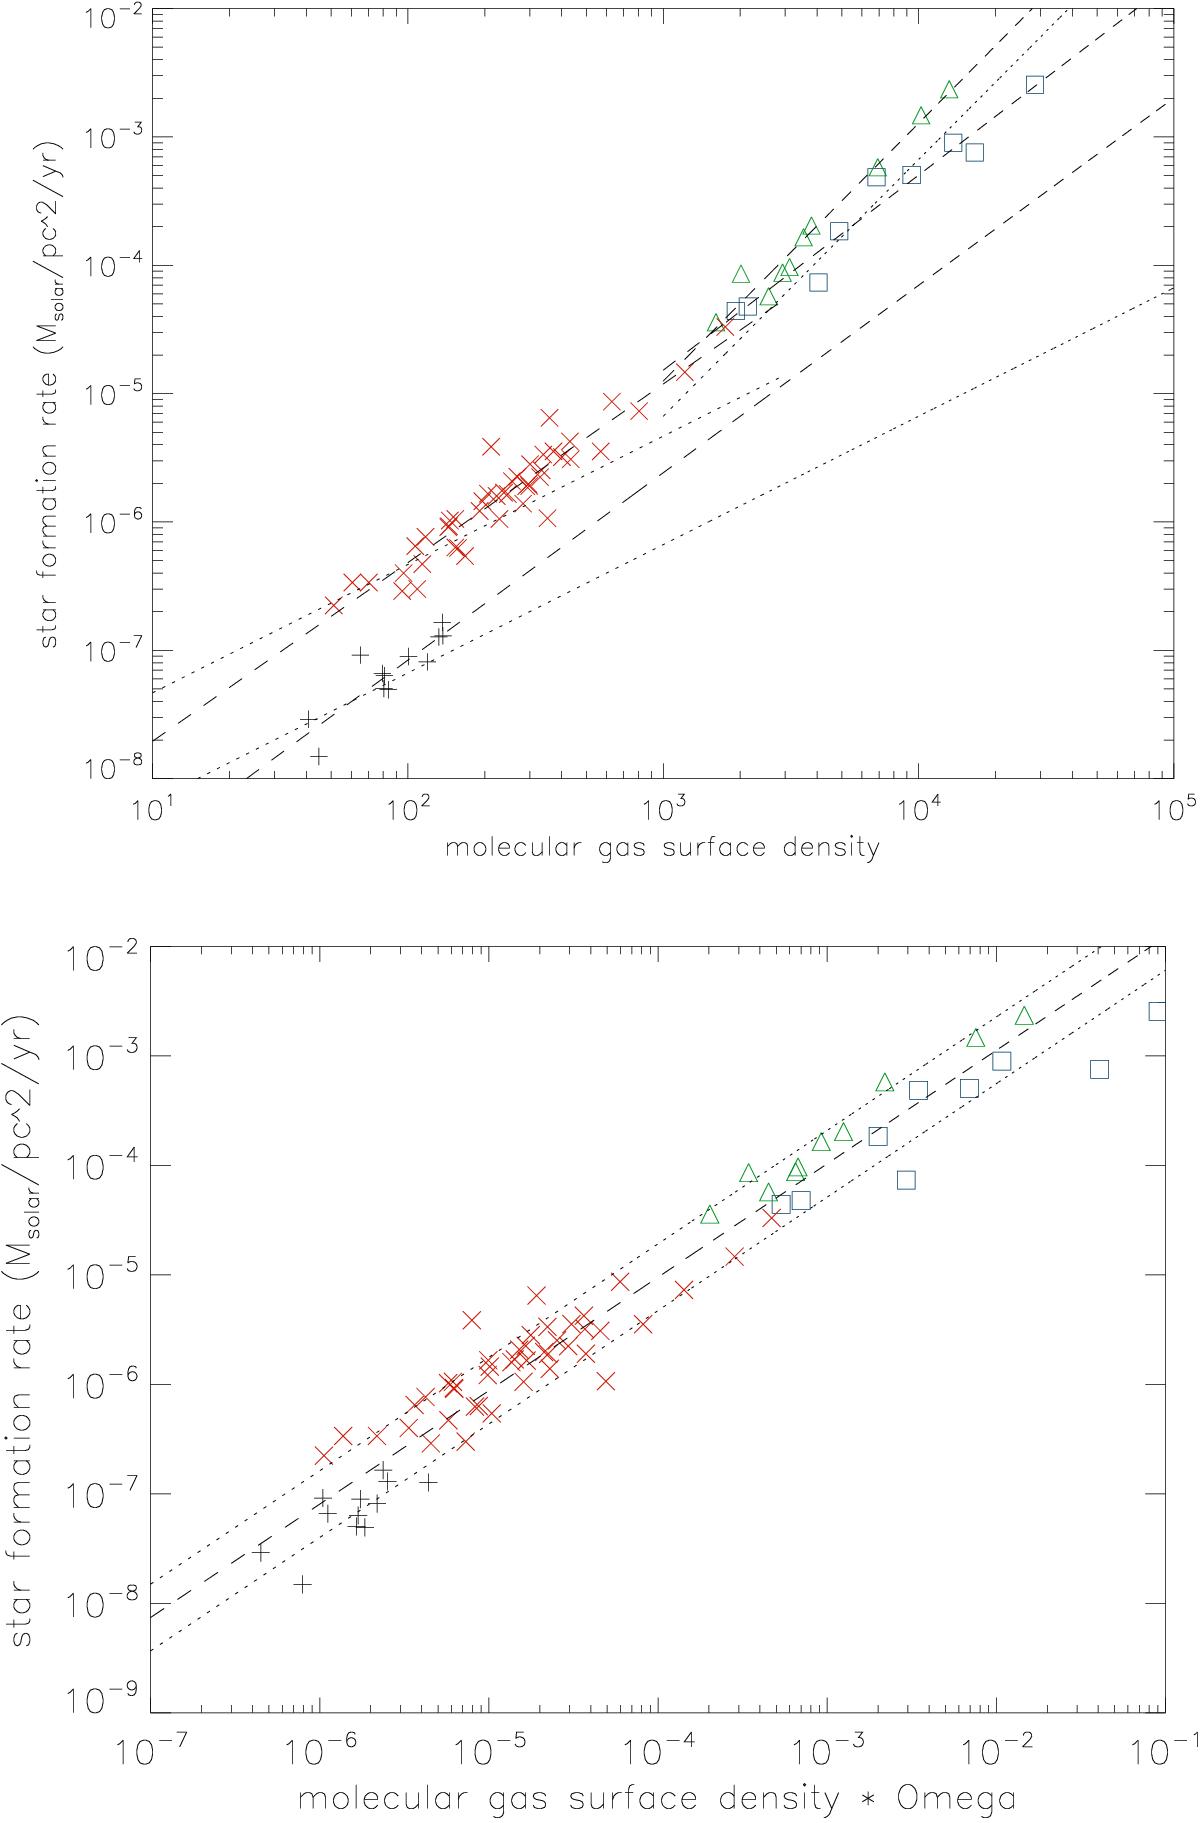
Upper panel: model star-formation rate surface density as a function of the model molecular gas surface density. The symbols are the same as in Fig. 10. The dotted lines are linear and square fits to guide the eye. The dashed lines are robust fits to the different galaxy samples. Lower panel: model star formation per unit area as a function of the model molecular gas surface density multiplied by the angular velocity (divided by the dynamical timescale). The dashed line represents a robust bisector fit to the entire sample with its associated rms (dotted lines).
Current usage metrics show cumulative count of Article Views (full-text article views including HTML views, PDF and ePub downloads, according to the available data) and Abstracts Views on Vision4Press platform.
Data correspond to usage on the plateform after 2015. The current usage metrics is available 48-96 hours after online publication and is updated daily on week days.
Initial download of the metrics may take a while.