Fig. 29
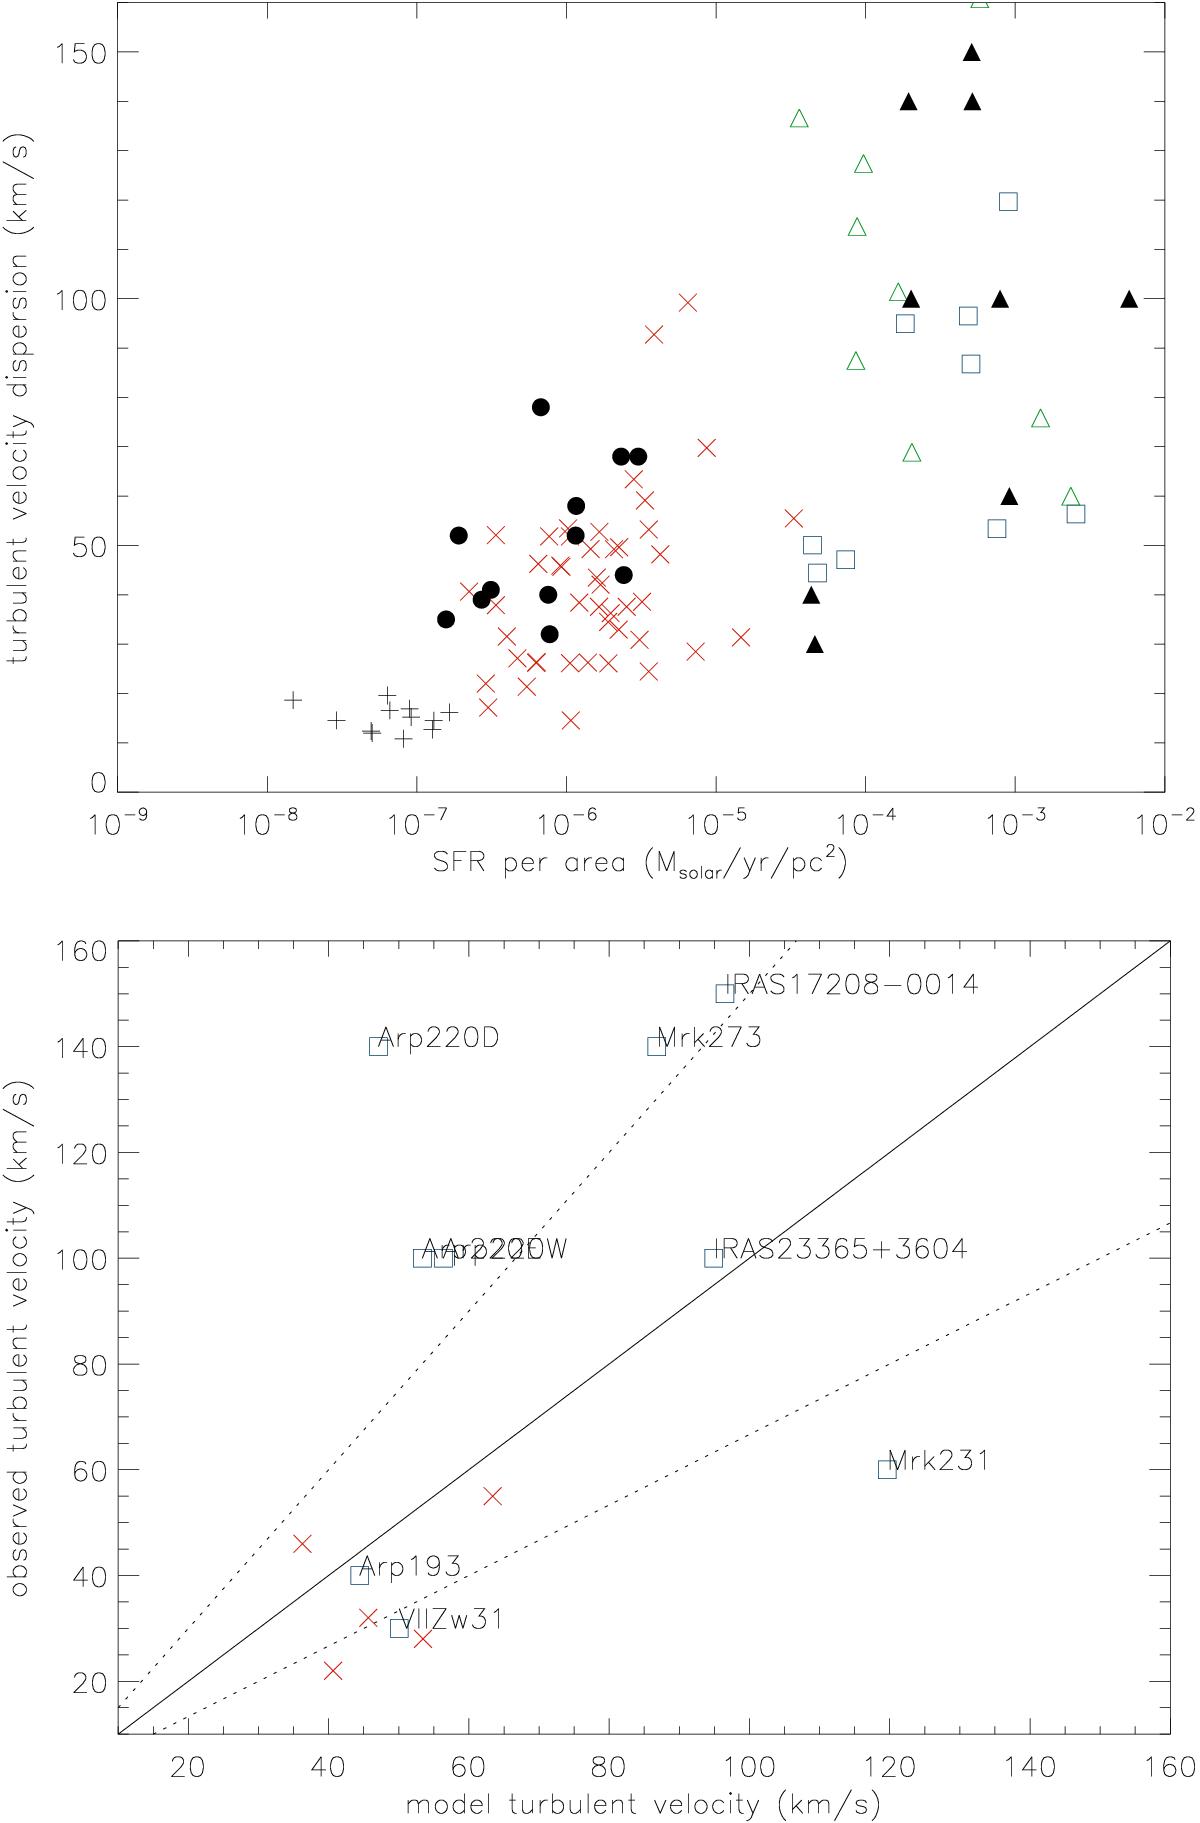
Upper panel: model turbulent velocity dispersion as a function of star-formation surface density. The symbols are the same as in Fig. 10. In addition, filled triangles are the observed velocity dispersions from Downes & Solomon (1998). Filled circles are observed Hα velocity dispersions from Cresci et al. (2009). Lower panel: observed CO velocity dispersion (Tacconi et al. 2013) as a function of the model velocity dispersion. The symbols are the same as in Fig. 10. The solid line corresponds to equality and the dotted lines to factors of 1/1.5 and 1.5.
Current usage metrics show cumulative count of Article Views (full-text article views including HTML views, PDF and ePub downloads, according to the available data) and Abstracts Views on Vision4Press platform.
Data correspond to usage on the plateform after 2015. The current usage metrics is available 48-96 hours after online publication and is updated daily on week days.
Initial download of the metrics may take a while.