Fig. 16
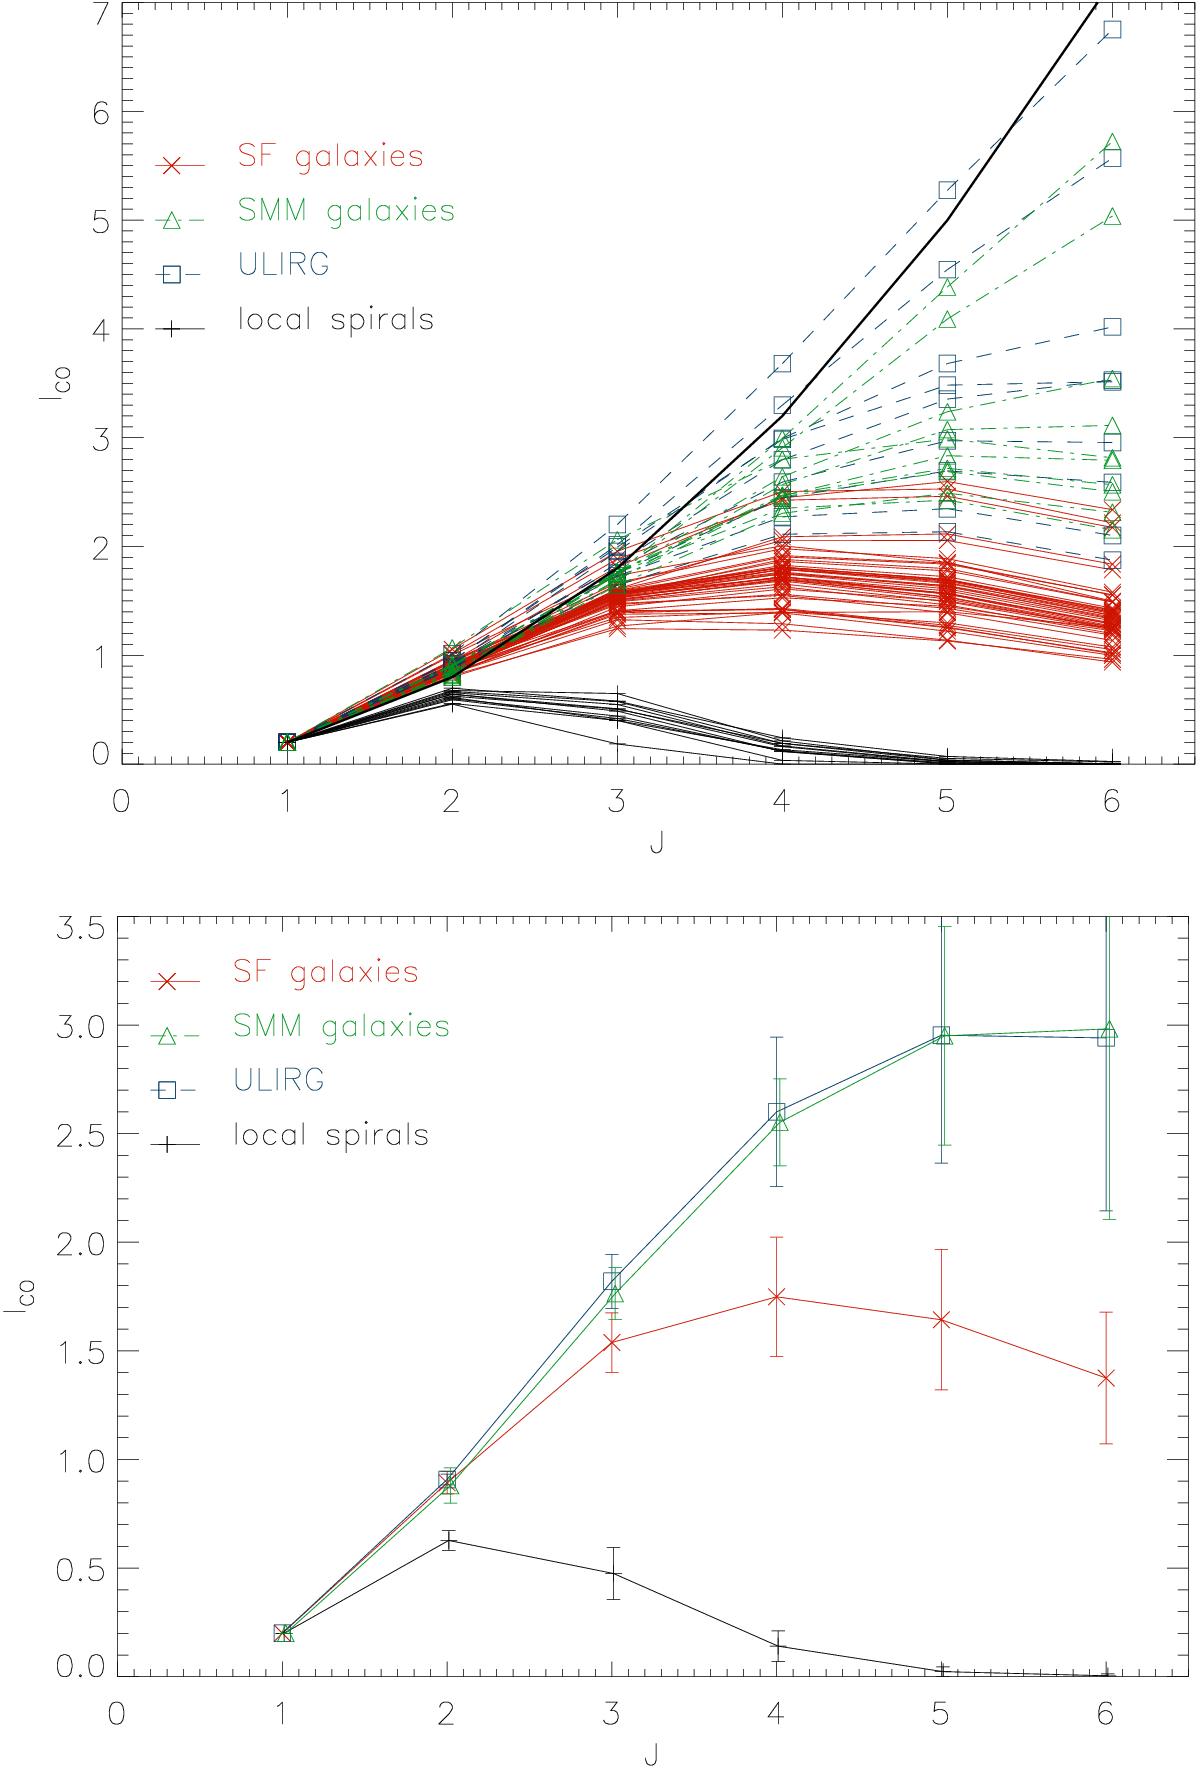
Upper panel: model CO spectral line energy distributions (SLEDs) of the local spiral, ULIRG, submillimeter, and high-z star-forming galaxies. The thick solid line corresponds to a constant brightness temperature. Lower panel shows the mean model CO SLEDs of our galaxy samples. For direct comparison with Fig. 8 of Daddi et al. (2015), the CO(1–0) emission of all galaxies was set to ICO = 0.2 Jy km s-1.

Current usage metrics show cumulative count of Article Views (full-text article views including HTML views, PDF and ePub downloads, according to the available data) and Abstracts Views on Vision4Press platform.
Data correspond to usage on the plateform after 2015. The current usage metrics is available 48-96 hours after online publication and is updated daily on week days.
Initial download of the metrics may take a while.