Fig. 12
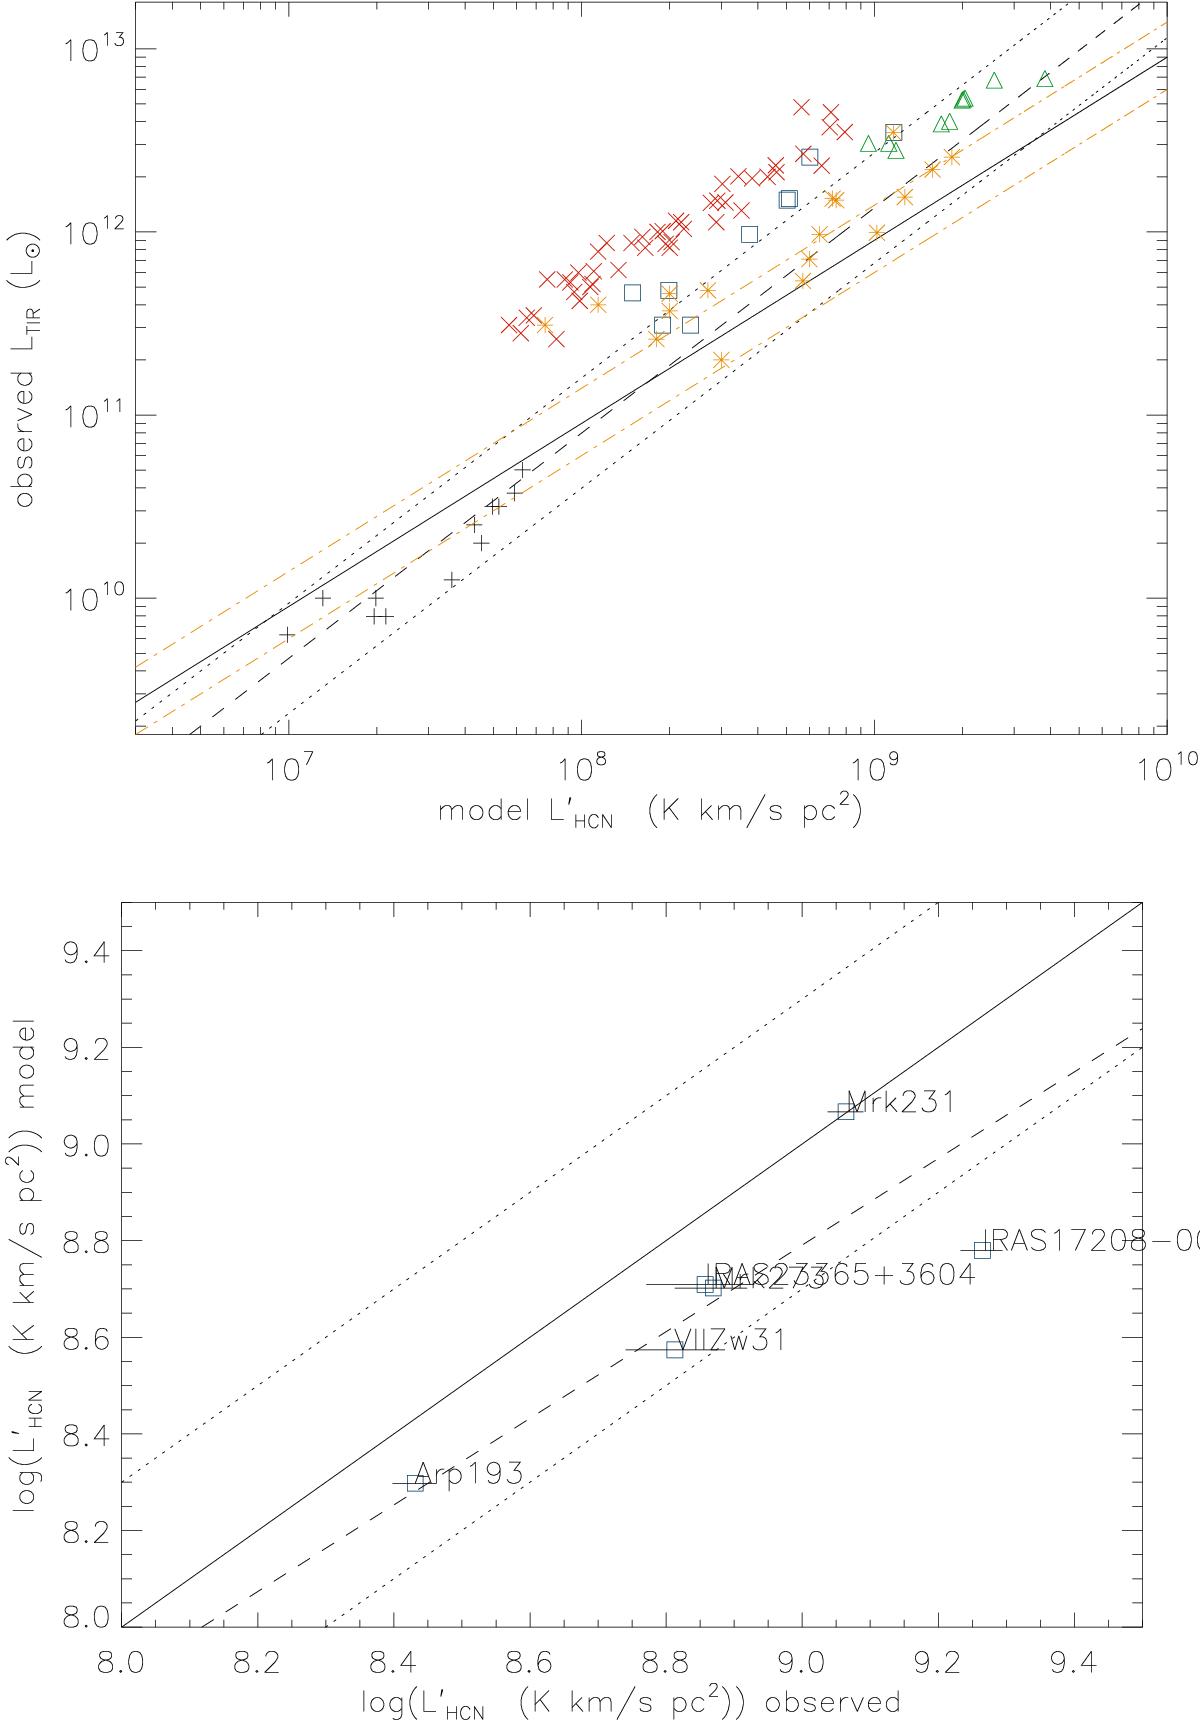
Upper panel: observed total infrared luminosity as a function of the model HCN(1–0) luminosity. The symbols are the same as in Fig. 10. In addition, orange stars represent the observed HCN(1–0) of an ULIRG subsample (from Graciá-Carpio et al. 2008). The solid line represents the correlation ![]() found by Gao & Solomon (2004). The dashed line represents the correlation found by Graciá-Carpio et al. (2008) with LTIR = 1.28 × LFIR:
found by Gao & Solomon (2004). The dashed line represents the correlation found by Graciá-Carpio et al. (2008) with LTIR = 1.28 × LFIR: ![]() . Lower panel shows the model HCN(1–0) luminosity as a function of the observed HCN(1–0) luminosity (Graciá-Carpio et al. 2008) for individual galaxies. The dashed line corresponds to a robust bisector fit.
. Lower panel shows the model HCN(1–0) luminosity as a function of the observed HCN(1–0) luminosity (Graciá-Carpio et al. 2008) for individual galaxies. The dashed line corresponds to a robust bisector fit.
Current usage metrics show cumulative count of Article Views (full-text article views including HTML views, PDF and ePub downloads, according to the available data) and Abstracts Views on Vision4Press platform.
Data correspond to usage on the plateform after 2015. The current usage metrics is available 48-96 hours after online publication and is updated daily on week days.
Initial download of the metrics may take a while.