Fig. 7
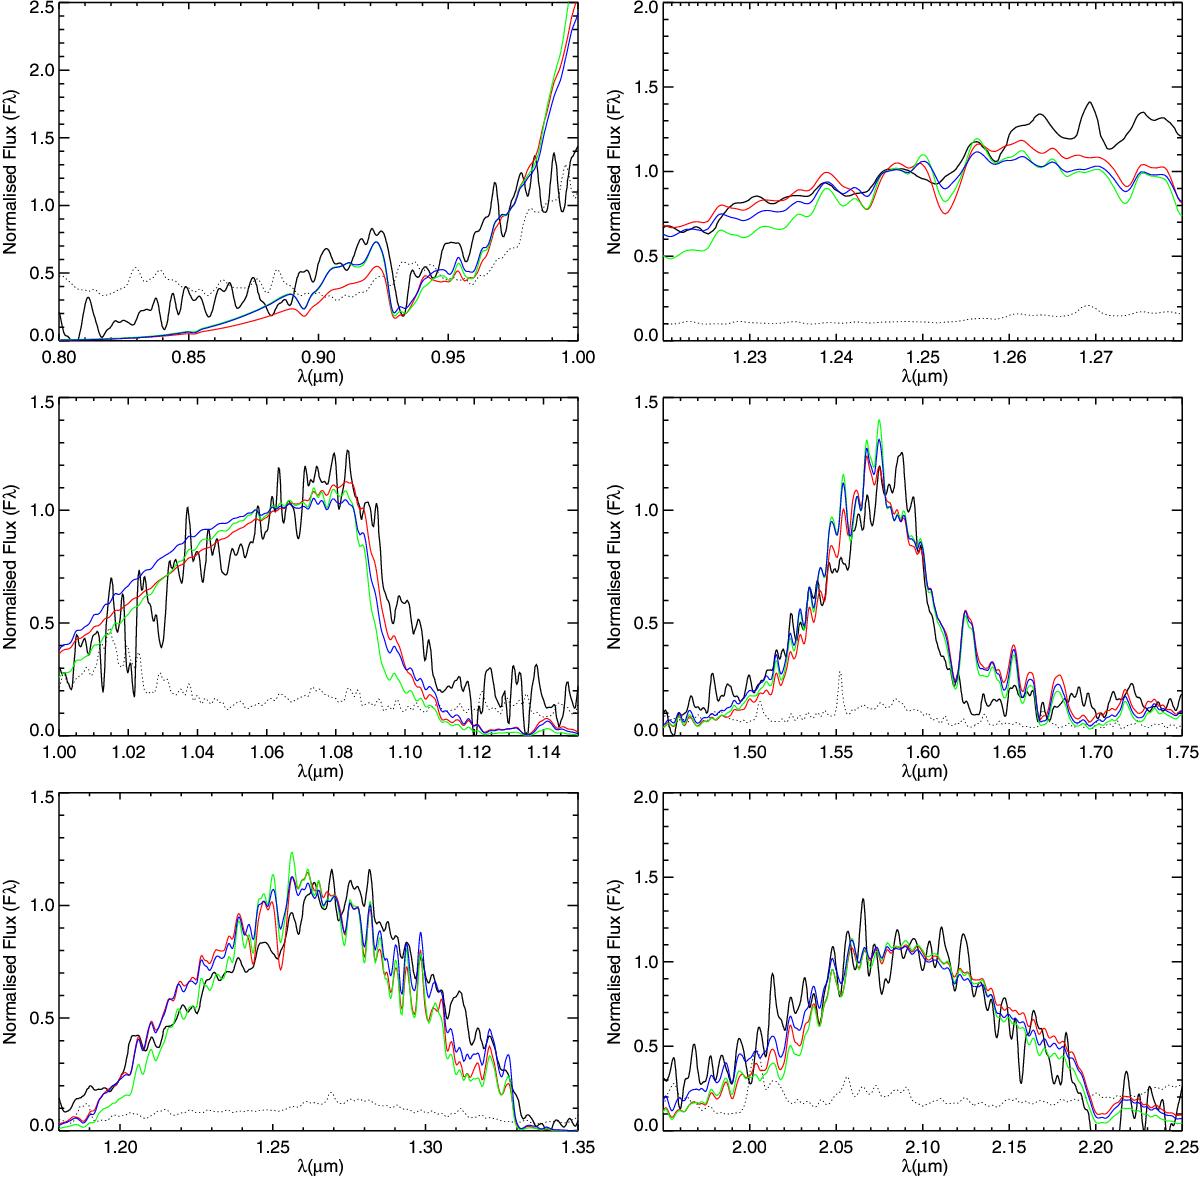
Observed spectrum of CFBDSIR 2149 in black in each spectral band and around the K i doublet. Noise from the observed spectrum is represented by the black dotted line. From top down and left to right the panels show the spectra in z at R ~ 300, and at R ~ 600 at all other wavelengths. The spectra presented here are normalised on their local peak intensity. Best fitting BT-Settl models models in absolute flux are represented in colour. Blue: model closest to the best fitting solution in absolute flux after interpolation on both chi2 maps (700 K, log g = 3.5, [M/H] = 0). Red: model closest to the best fitting solution in absolute flux after interpolation on the high-metallicity chi2 map (800 K, log g = 5.0, [M/H] = 0.3). Green: best fitting model in absolute flux without interpolation (650 K, log g = 3.5, [M/H] = 0.3).
Current usage metrics show cumulative count of Article Views (full-text article views including HTML views, PDF and ePub downloads, according to the available data) and Abstracts Views on Vision4Press platform.
Data correspond to usage on the plateform after 2015. The current usage metrics is available 48-96 hours after online publication and is updated daily on week days.
Initial download of the metrics may take a while.