Fig. 3
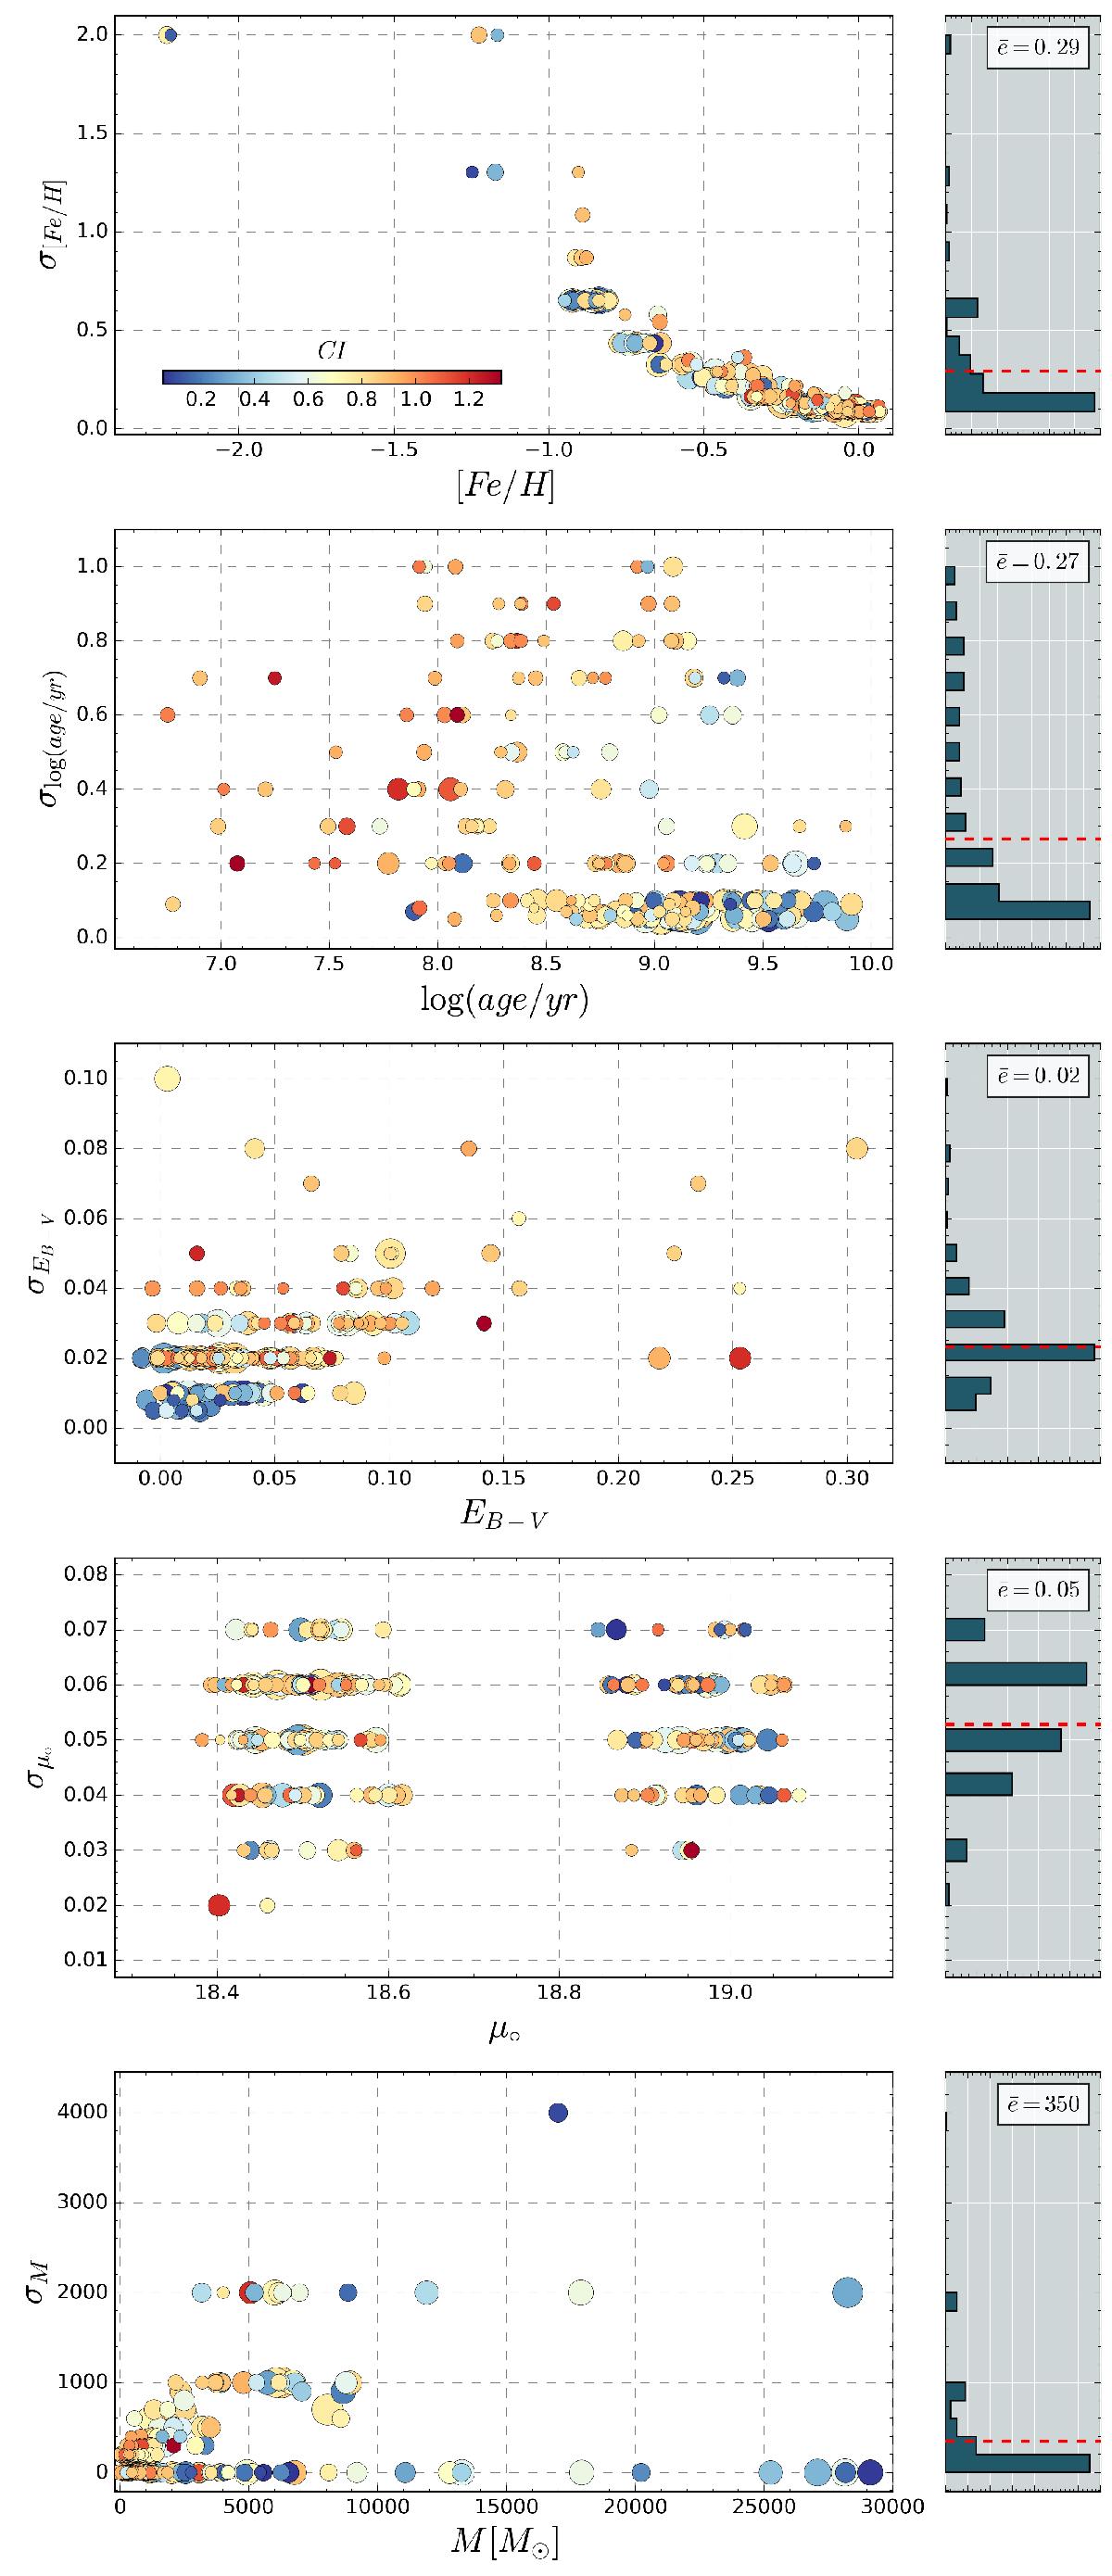
Left: distribution of errors vs. the five parameters fitted by ASteCA. Colors are associated with the CI (see bar in top plot); sizes are proportional to the actual cluster sizes. A small random scatter in the x-axis is added for clarity. Right: error histogram. The mean error value for each parameter is shown in the top right corner and drawn in the plot with a dashed red line.
Current usage metrics show cumulative count of Article Views (full-text article views including HTML views, PDF and ePub downloads, according to the available data) and Abstracts Views on Vision4Press platform.
Data correspond to usage on the plateform after 2015. The current usage metrics is available 48-96 hours after online publication and is updated daily on week days.
Initial download of the metrics may take a while.