Free Access
Fig. 1
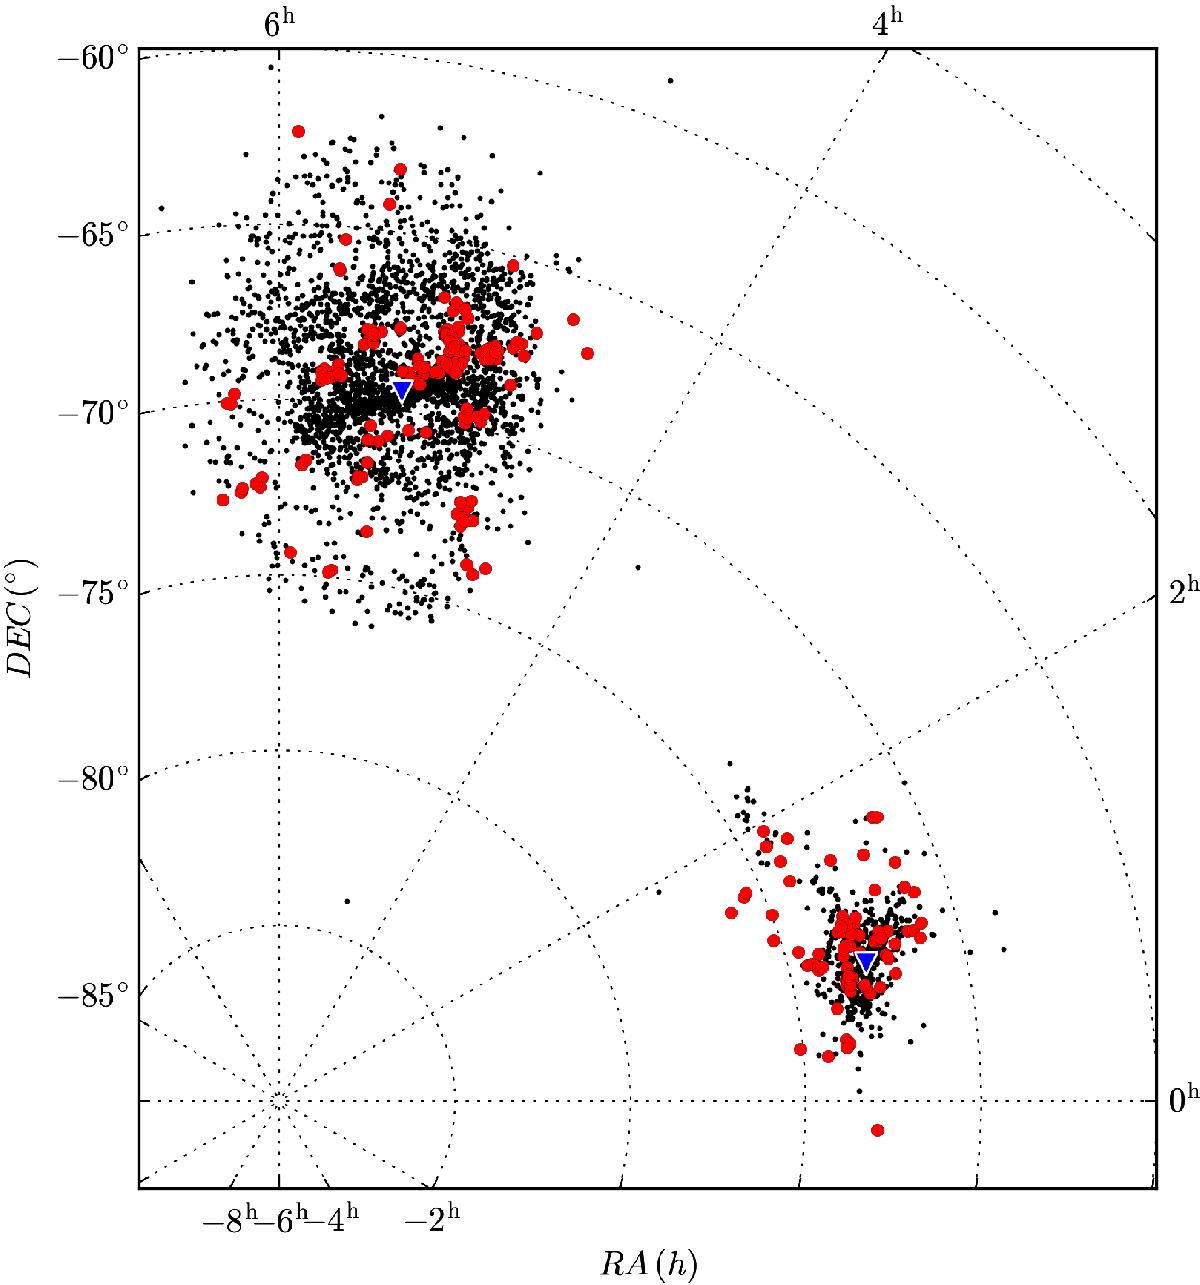
Distribution of our set of analyzed clusters (red circles) superimposed on to the Bica et al. (2008) database of 3740 star clusters (black dots) for both MCs. The assumed centers for the Clouds are indicated with blue triangles.
Current usage metrics show cumulative count of Article Views (full-text article views including HTML views, PDF and ePub downloads, according to the available data) and Abstracts Views on Vision4Press platform.
Data correspond to usage on the plateform after 2015. The current usage metrics is available 48-96 hours after online publication and is updated daily on week days.
Initial download of the metrics may take a while.