Fig. 7
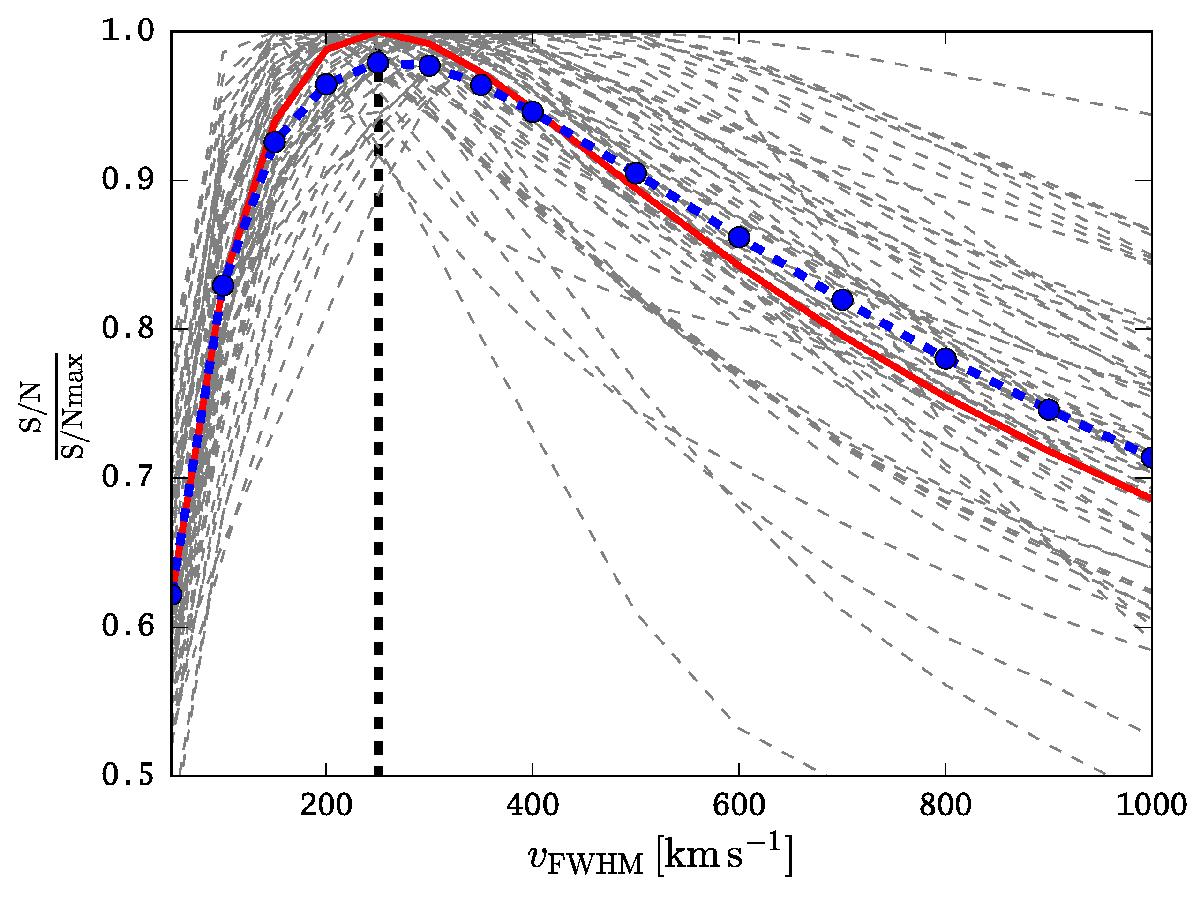
Ratio ξ = (S / N) / (S / Nmax) for all Lyman α-emitting sources in the Hubble Deep Field South MUSE datacube from Bacon et al. (2015). Here, S/Nmax is the maximum S/Npeak value of a source, over all considered filter widths. The grey lines denote the ξ for the individual emitters, while the blue points and connecting dashed curve show the average relation. For a filter width of FWHMv = 250 km s-1 (vertical dashed line), almost all Lyman α line emitters have ξ> 90%. The red curve shows the theoretically expected ratio ![]() for an assumed Gaussian emission line with FWHMv,true = 250 km s-1 filtered with an incorrect template of width FWHMv = κ × FWHMv,true.
for an assumed Gaussian emission line with FWHMv,true = 250 km s-1 filtered with an incorrect template of width FWHMv = κ × FWHMv,true.
Current usage metrics show cumulative count of Article Views (full-text article views including HTML views, PDF and ePub downloads, according to the available data) and Abstracts Views on Vision4Press platform.
Data correspond to usage on the plateform after 2015. The current usage metrics is available 48-96 hours after online publication and is updated daily on week days.
Initial download of the metrics may take a while.