Fig. 6
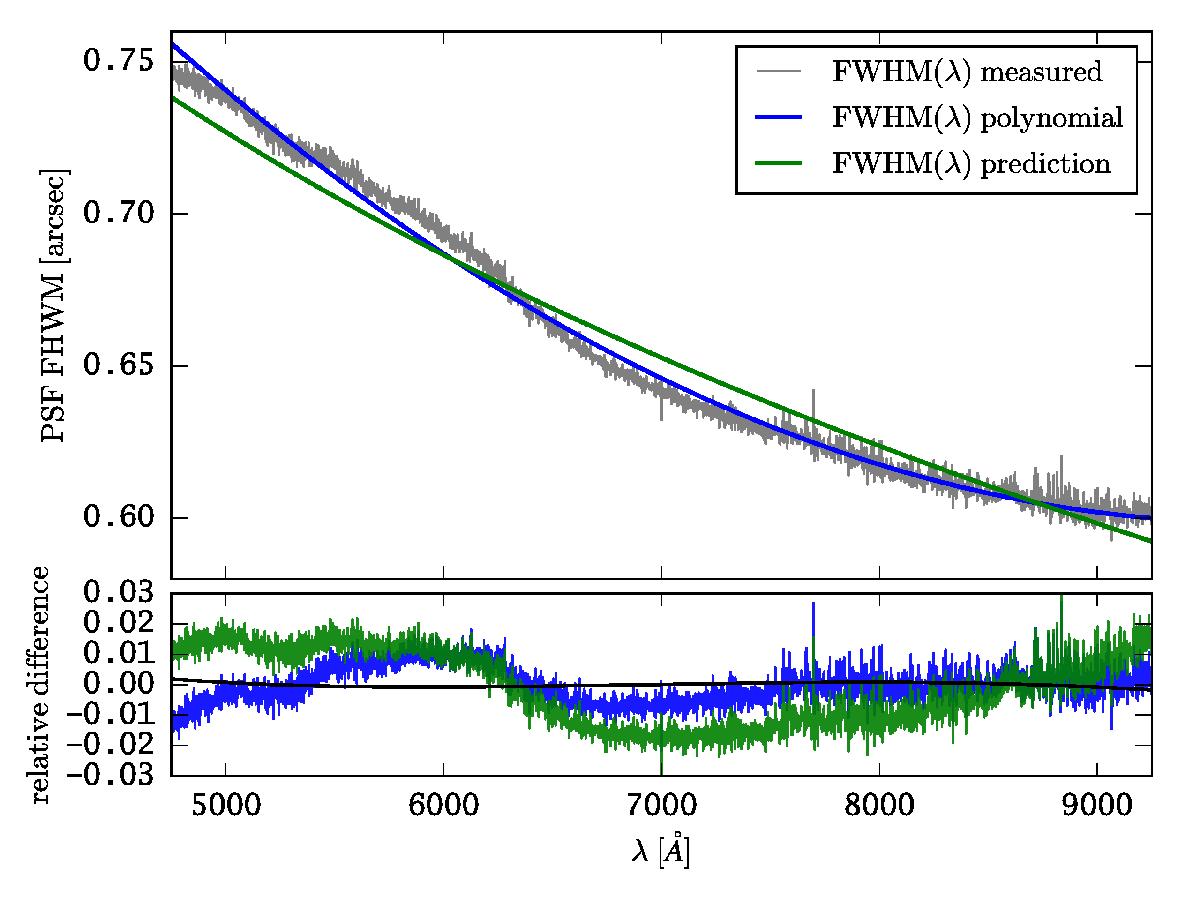
Wavelength dependence of the PSF FWHM in the MUSE HDFS datacube (Bacon et al. 2015). The grey curve shows the FWHM from a Moffat fit to the brightest star in the field, the blue curve shows a quadratic polynomial fit to the grey curve, and the green curve shows the analytic prediction for FWHM(λ) from Tokovinin (2002; see Sect. 4.2 for details). In the bottom panel we show the relative difference between polynomial and analytic prediction from the measured PSF FWHM. The black curve in the bottom panel shows the relative difference between the analytic prediction and a polynomial fit to this prediction.
Current usage metrics show cumulative count of Article Views (full-text article views including HTML views, PDF and ePub downloads, according to the available data) and Abstracts Views on Vision4Press platform.
Data correspond to usage on the plateform after 2015. The current usage metrics is available 48-96 hours after online publication and is updated daily on week days.
Initial download of the metrics may take a while.