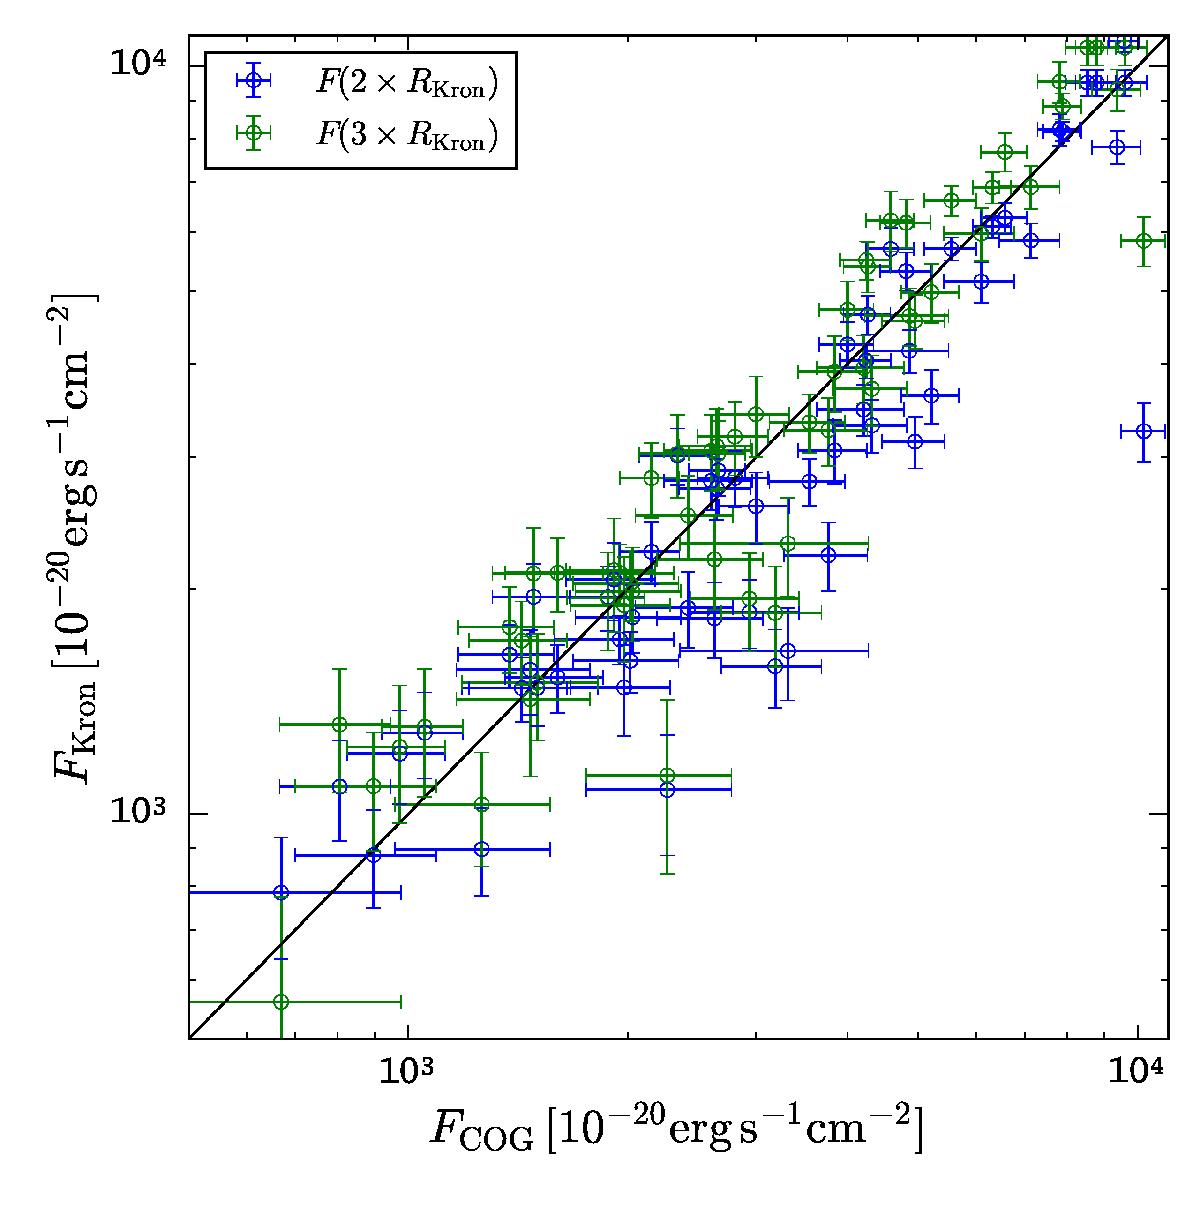
Fig. 5

Comparison of automatic flux measurements by LSDCat (FKron) with fluxes measured manually by curve-of-growth (FCOG) integration, for a sample of 60 Lyman α emission lines in MUSE datacubes. The automatic measurements were extracted according to Eq. (26) and Eq. (27), using spatial apertures of 2RKron (blue symbols) and 3RKron (green symbols) and adopting S / Nana = 3.5. The manual method used to measure the fluxes is explained in Sect. 3.4. The black diagonal line indicates the 1:1 relation. The gross deviation for the brightest object in the sample is caused by a strongly double-peaked Lyman α line profile with significant peak separation. Here the narrow-band window automatically determined by LSDCat treated the stronger peak as a single emission line, while the trained eye was able to adjust the window accordingly to include both peaks.
Current usage metrics show cumulative count of Article Views (full-text article views including HTML views, PDF and ePub downloads, according to the available data) and Abstracts Views on Vision4Press platform.
Data correspond to usage on the plateform after 2015. The current usage metrics is available 48-96 hours after online publication and is updated daily on week days.
Initial download of the metrics may take a while.


