Fig. 4
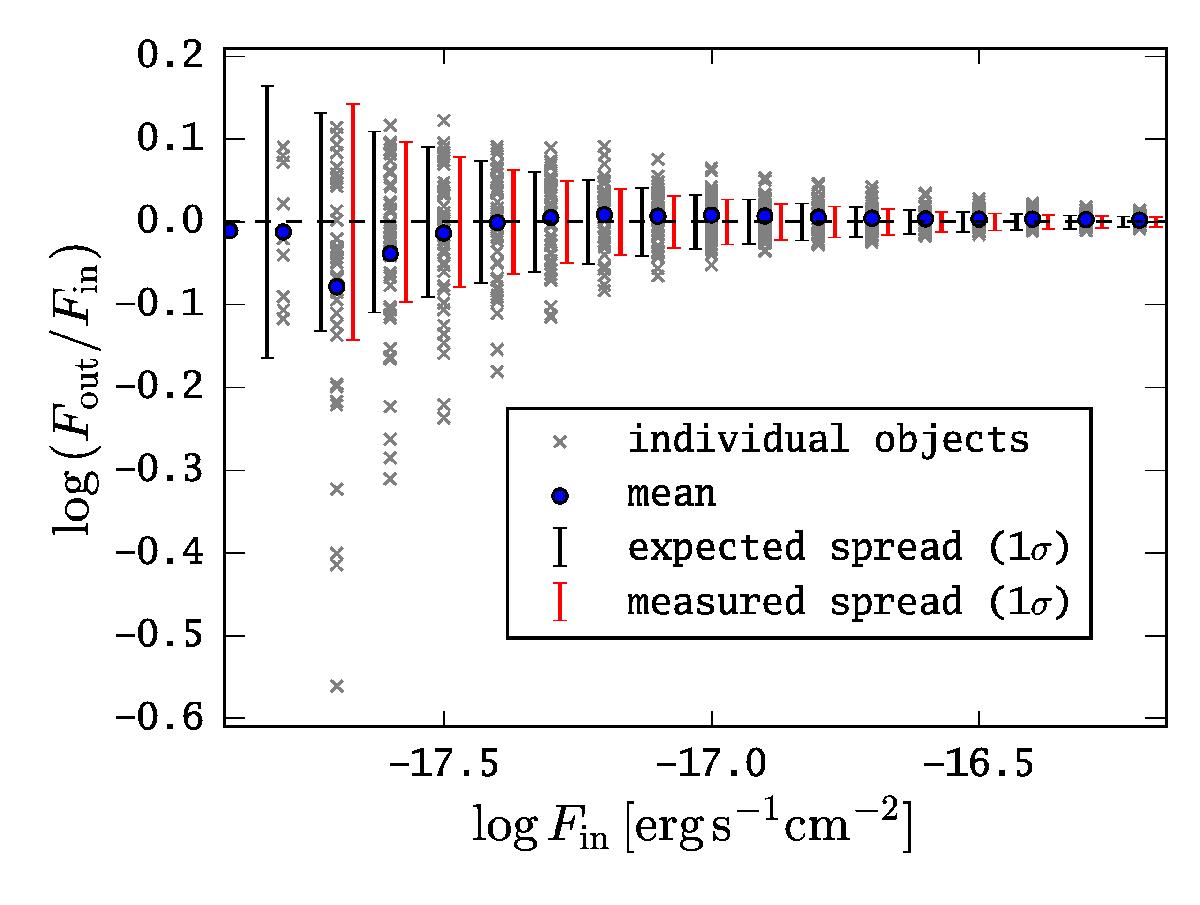
Validation of the emission line flux integration routine utilising implanted emission lines in the MUSE HDF-S datacube described in Sect. 3.1. The input flux of the implanted emission lines is shown on the abscissa, while on the ordinate we show the logarithmic difference between input flux and measured flux by LSDCat: log Fout [ erg s-1 cm-2 ] − log Fin [ erg s-1 cm-2 ] = log (Fout/Fin). Measured fluxes are obtained in apertures of 3·RKron. Grey crosses show the obtained difference for each individual object, while the blue circle shows the mean difference of all measured fluxes at a given input flux. The red bars indicate the spread (measured standard deviation) over all measured fluxes at a given input flux, while the black bars indicate the expected spread (predicted standard deviation) according to the average uncertainty of the flux measurement at a given input flux. For clarity, the red and black bars have been offset slightly to the positive and negative, respectively, from the actual input flux.
Current usage metrics show cumulative count of Article Views (full-text article views including HTML views, PDF and ePub downloads, according to the available data) and Abstracts Views on Vision4Press platform.
Data correspond to usage on the plateform after 2015. The current usage metrics is available 48-96 hours after online publication and is updated daily on week days.
Initial download of the metrics may take a while.