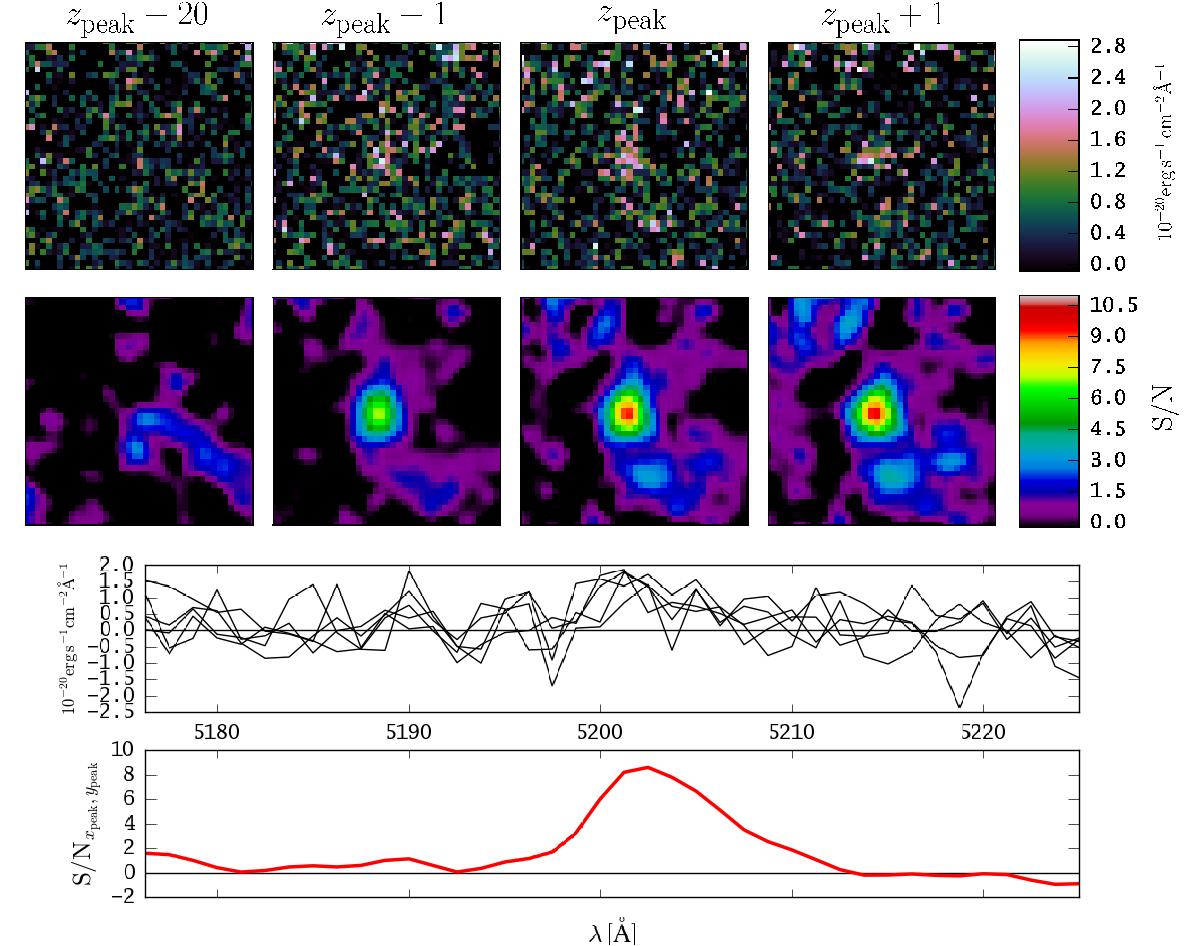
Fig. 2

Example of the effect of matched filtering on the detectability of a faint emission-line source in the MUSE datacube of the Hubble Deep Field South (Bacon et al. 2015). Shown is a Lyman α emitting galaxy at redshift z = 3.278 with flux FLyα = 1.3 × 10⁻¹⁸ erg s-1 (ID #162 in Bacon et al. 2015). The panels in the first row display four different spectral layers of the continuum-subtracted datacube F. The second row shows the same spectral layers, but for the filtered S / N cube (Eq. (9)) that was used to build the catalogue of emission line sources via thresholding (Eq. (18)). The leftmost panels show a layer significantly away from the emission line peak, the other panels show layers at spectral coordinates zpeak − 1, zpeak, and zpeak + 1, respectively, where zpeak designates the layer containing the maximum S / N value of the source. The third row shows the flux density spectrum in the spaxels at (xpeak,ypeak) and (xpeak ± 1,ypeak ± 1), where xpeak and ypeak are the spatial coordinates of the highest S/N value. The bottom row shows a S/N spectrum extracted from the S / N cube at xpeak and ypeak.
Current usage metrics show cumulative count of Article Views (full-text article views including HTML views, PDF and ePub downloads, according to the available data) and Abstracts Views on Vision4Press platform.
Data correspond to usage on the plateform after 2015. The current usage metrics is available 48-96 hours after online publication and is updated daily on week days.
Initial download of the metrics may take a while.


