Fig. 9
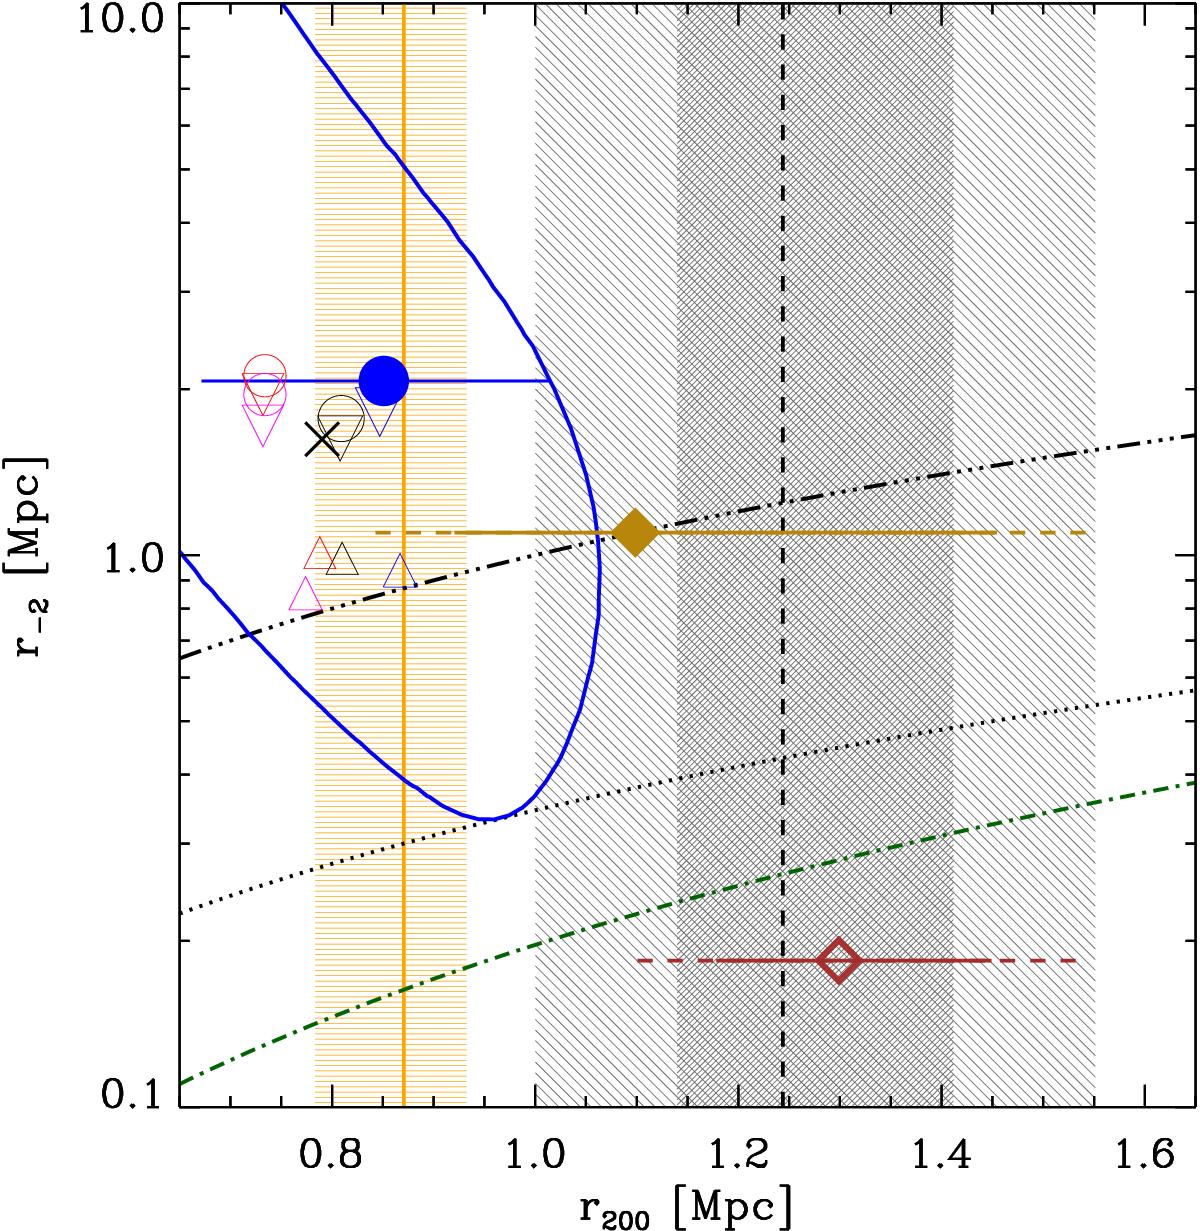
Results for the M(r) parameters r200 and r-2. The blue contour indicates the 68% confidence level on the best-fit values obtained in MAMPOSSt (blue dot) for the best-fit models NFW+T (see text), after marginalization over the anisotropy parameter. The horizontal solid blue segment indicates the error on the best-fit r200 value, obtained after marginalization over the r-2 and the anisotropy parameter. The best-fit results of other models are indicated by the open symbols, triangle, inverted triangle, and circle, for the Bur, Her, NFW models, respectively, black, red, magenta, and blue for the combination with the C, ML, OM, and T models, respectively The size of the symbols is proportional to the relative likelihood of the models. The black cross indicates the mean [ r200,r-2 ], taking the average over all models. The vertical, black dashed line indicate the r200 value obtained by D09 from their kinematic analysis. The uncertainties on this value, also taken from D09, are indicated by shaded grey regions, where the pale grey shading includes both the statistical and the systematic uncertainties, while the dark grey shading only includes the statistical uncertainty. The vertical orange line and orange shading indicate the r200 value and uncertainty obtained from the cluster LX (from D09) using the scaling relation of Rykoff et al. (2008). The open maroon diamond indicates the r200 value obtained by D09 from their lensing analysis. The position along the y-axis indicates the r-2 value corresponding to the assumed concentration r200/r-2 used in D09 for the determination of the cluster lensing mass. The statistical and statistical+systematic uncertainties on this value are indicated by the maroon solid and dashed line, respectively. The filled gold diamond indicates the new determination of r200 from the lensing analysis applied to the same data used in D09, but this time using a concentration r200/r-2 = 1. This value of the concentration is used to set the position of the point along the y-axis. The dash-dotted green curve is the r-2 vs. r200 relation derived from the concentration-mass relation of Correa et al. (2015c) at the cluster redshift, computed with the code COMMAH (see also Correa et al. 2015a,b). The triple-dot-dashed black curve indicates the r200 = r-2 relation. The dotted black curve indicates the c200 = 2.9 relation, namely the highest concentration that is still marginally acceptable according to the MAMPOSSt dynamical analysis.
Current usage metrics show cumulative count of Article Views (full-text article views including HTML views, PDF and ePub downloads, according to the available data) and Abstracts Views on Vision4Press platform.
Data correspond to usage on the plateform after 2015. The current usage metrics is available 48-96 hours after online publication and is updated daily on week days.
Initial download of the metrics may take a while.