Fig. 7
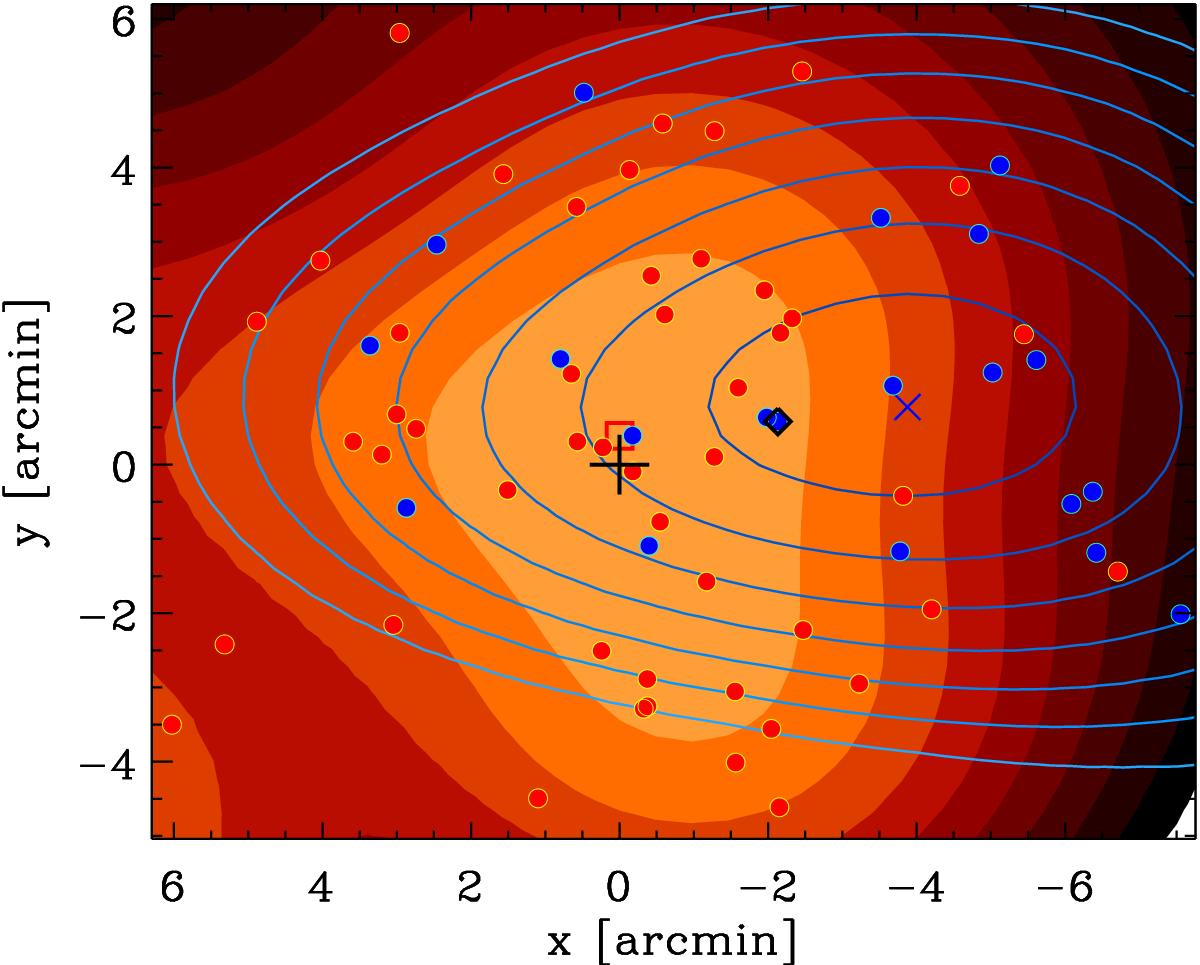
Adaptive-kernel maps of the number density of cluster members with magnitude zPetro ≤ 19.64, corrected for incompleteness of the spectroscopic sample. Filled, red-orange contours represent the number densities of the KMM-main subcluster, open, blue-cyan contours represent the number densities of the KMM-sub one. The red square and blue X identify the density peaks of the KMM-main and KMM-sub density maps, respectively. The contours are logarithmically spaced. The red (blue) dots identify member galaxies with velocity > − 621 km s-1 (respectively ≤ − 621 km s-1) and are thus more (less) likely to belong to the KMM-main subcluster than to the KMM-sub one. The black cross identifies our adopted center of A315, from the analysis of the adaptive kernel density map of all members. The black diamond identifies the center used in D09.
Current usage metrics show cumulative count of Article Views (full-text article views including HTML views, PDF and ePub downloads, according to the available data) and Abstracts Views on Vision4Press platform.
Data correspond to usage on the plateform after 2015. The current usage metrics is available 48-96 hours after online publication and is updated daily on week days.
Initial download of the metrics may take a while.