Fig. 4
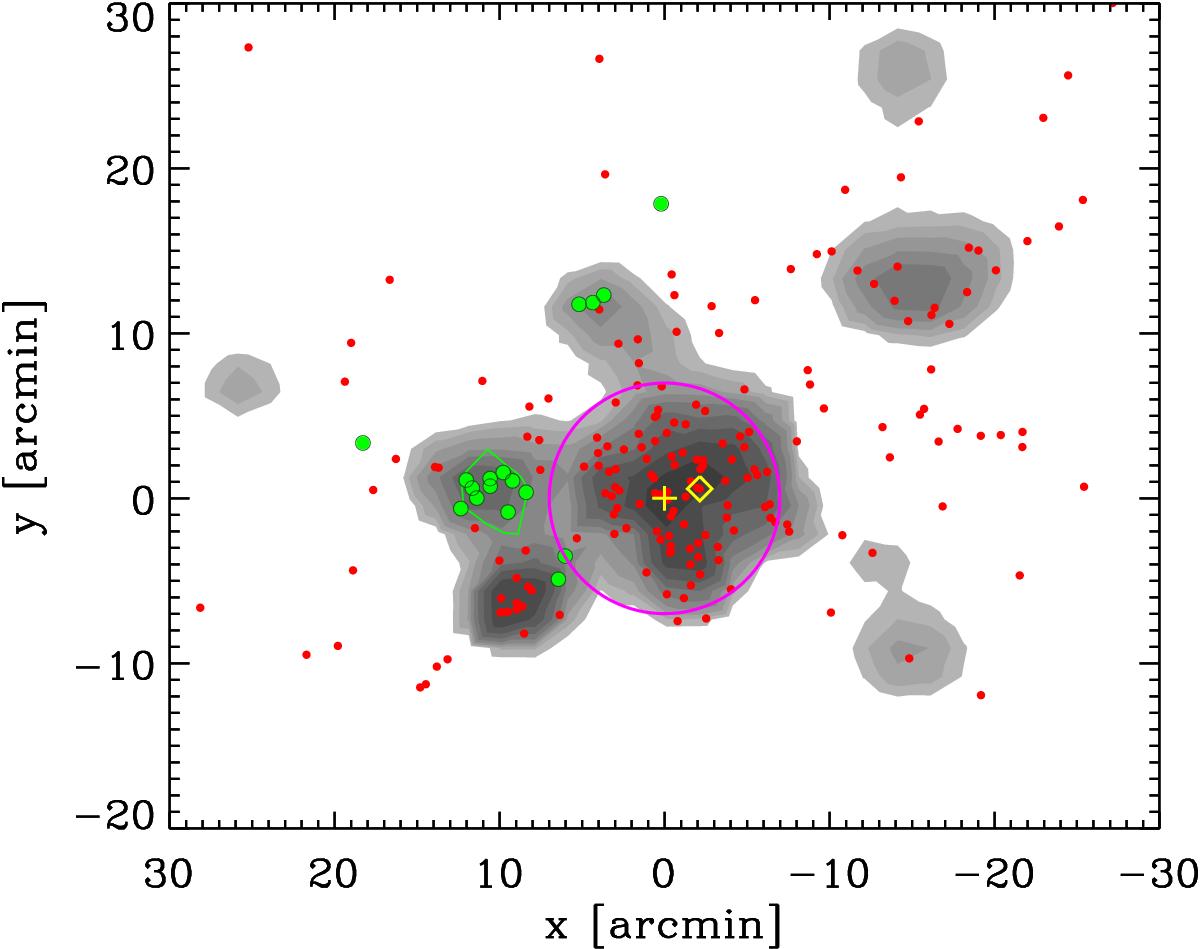
Adaptive-kernel map of the number density of cluster members with magnitude zPetro ≤ 19.64, corrected for incompleteness of the spectroscopic sample. Darker shadings indicate higher densities, logarithmically spaced. The red dots identify all galaxies which are identified as cluster members by the SG algorithm (see Sect. 3). The green dots identify the galaxies flagged by the DSb procedure (described in Appendix A) as possible members of substructures. The green polygon indicates 10 of these galaxies that appear to form a compact group (the “DSb group”). The map is centered at the point of maximum projected number density of cluster galaxies, as in Fig. 2 (also indicated by a yellow plus sign). North is up and east is to the left. The yellow diamond symbol identifies the position of the galaxy used as a cluster center in D09. The purple circle has a radius of 1.24 Mpc and indicates the cluster virial region (see Sect. 3).
Current usage metrics show cumulative count of Article Views (full-text article views including HTML views, PDF and ePub downloads, according to the available data) and Abstracts Views on Vision4Press platform.
Data correspond to usage on the plateform after 2015. The current usage metrics is available 48-96 hours after online publication and is updated daily on week days.
Initial download of the metrics may take a while.