Fig. A.1
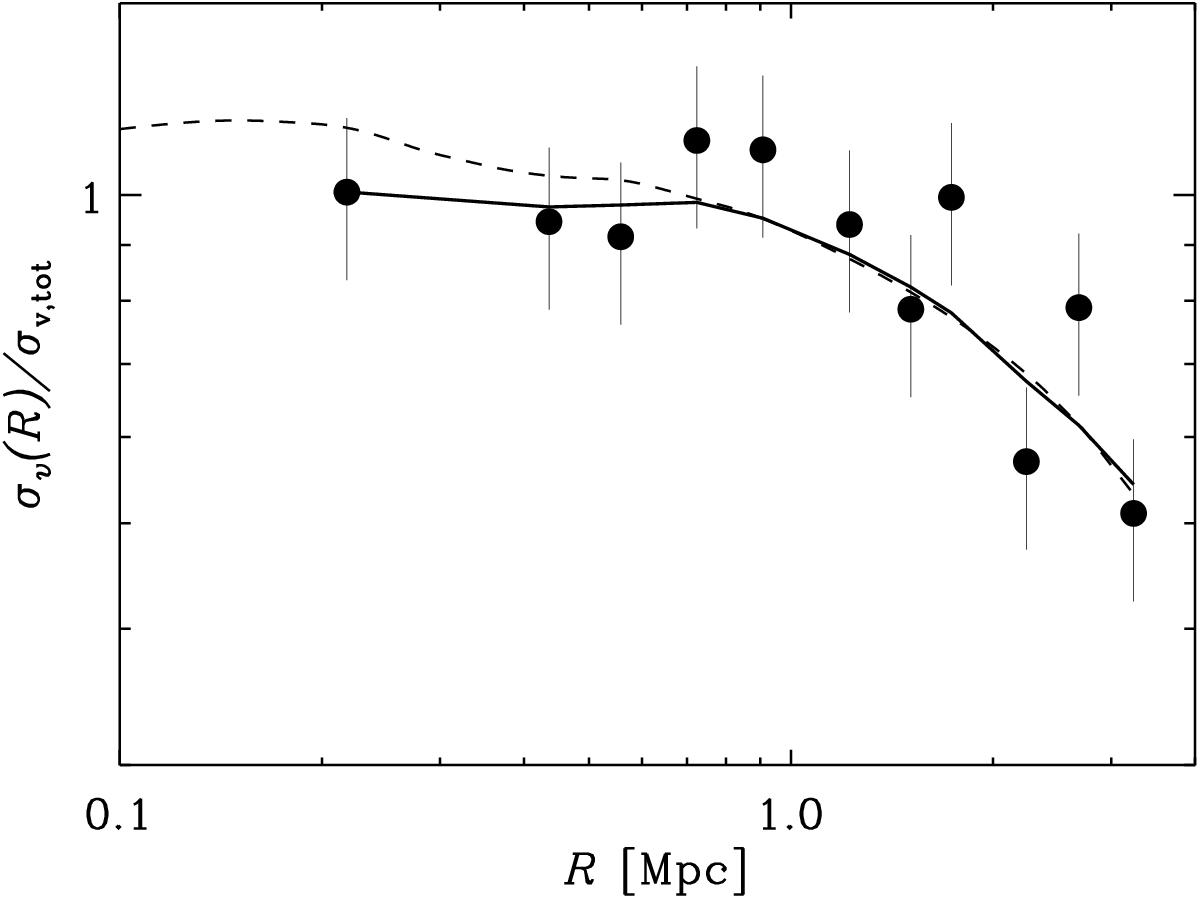
Cluster projected velocity dispersion profile, normalized by the total velocity dispersion (dots with 1σ error bars). The solid curve represent the smoothed profile, adopted in the Dressler and Shectman test. The dashed curve shows, for comparison, the smoothed profile obtained for a sample of nearby clusters by Biviano et al. (2002).
Current usage metrics show cumulative count of Article Views (full-text article views including HTML views, PDF and ePub downloads, according to the available data) and Abstracts Views on Vision4Press platform.
Data correspond to usage on the plateform after 2015. The current usage metrics is available 48-96 hours after online publication and is updated daily on week days.
Initial download of the metrics may take a while.