Fig. 2
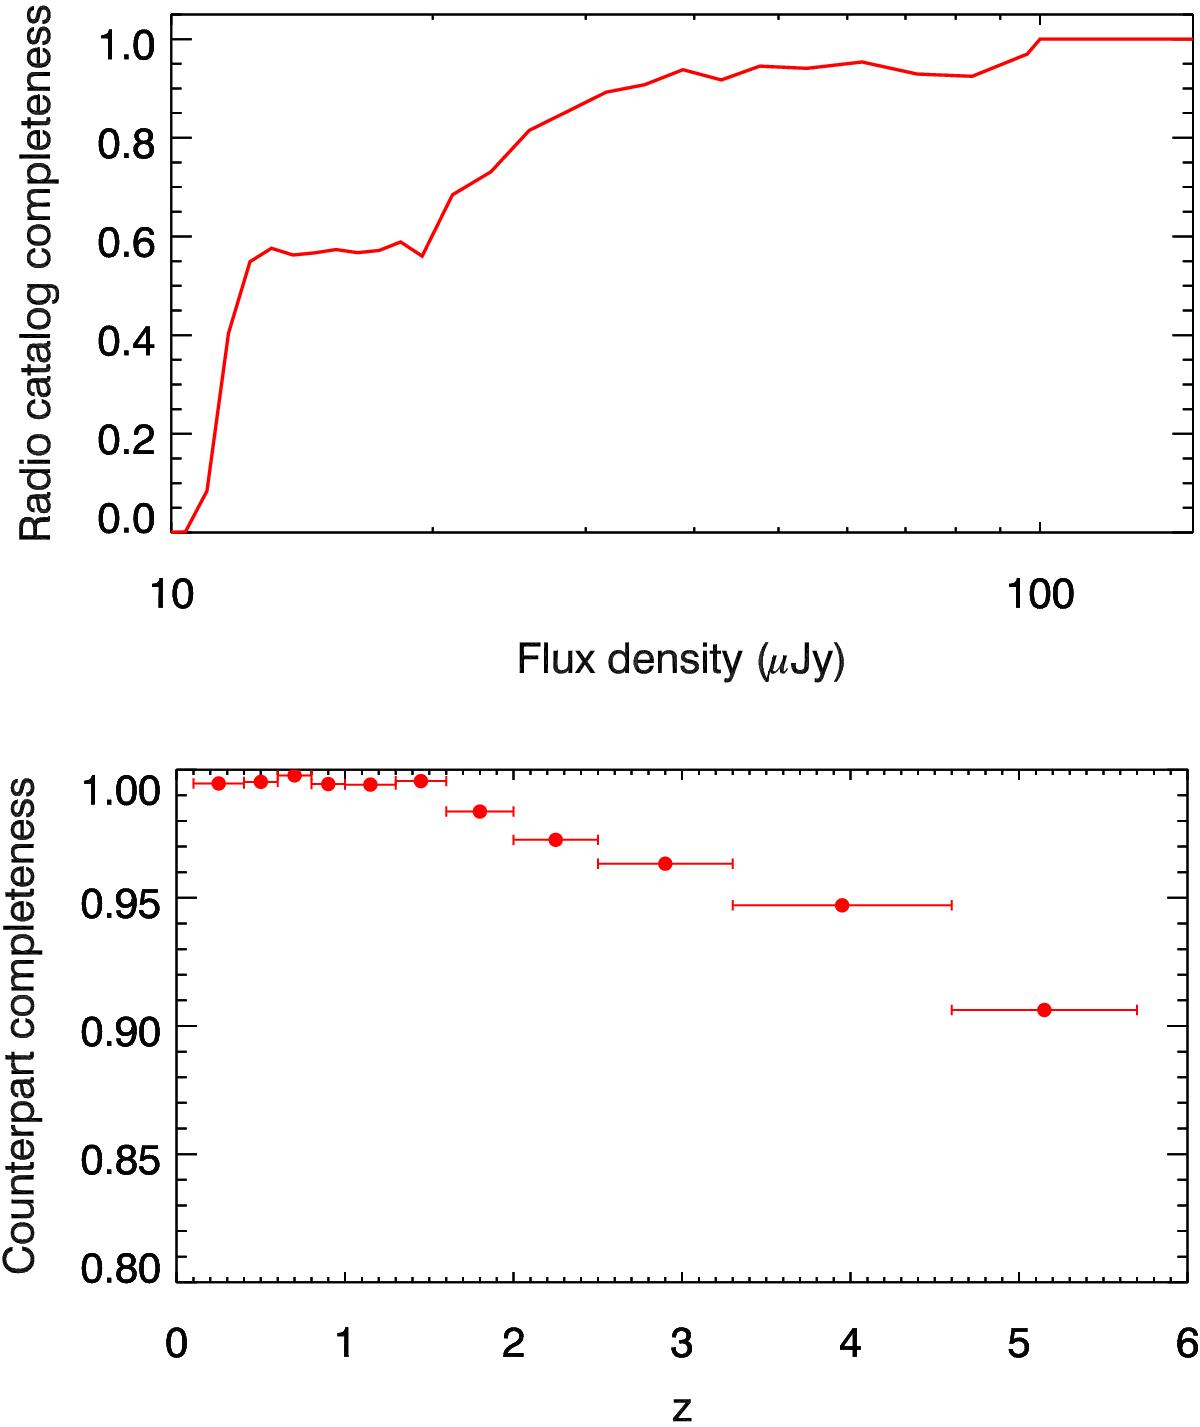
Top: Radio catalog completeness based on Monte Carlo simulations and mock source insertions (from Smolčić et al. 2017a). They take into account resolution bias, nonuniform rms, and flux density redistribution due to the source extraction process. Bottom: optical-NIR counterpart completeness based on the amount of additional i-band sources that could be matched to our radio sources (see text for details).
Current usage metrics show cumulative count of Article Views (full-text article views including HTML views, PDF and ePub downloads, according to the available data) and Abstracts Views on Vision4Press platform.
Data correspond to usage on the plateform after 2015. The current usage metrics is available 48-96 hours after online publication and is updated daily on week days.
Initial download of the metrics may take a while.