Free Access
Fig. 1
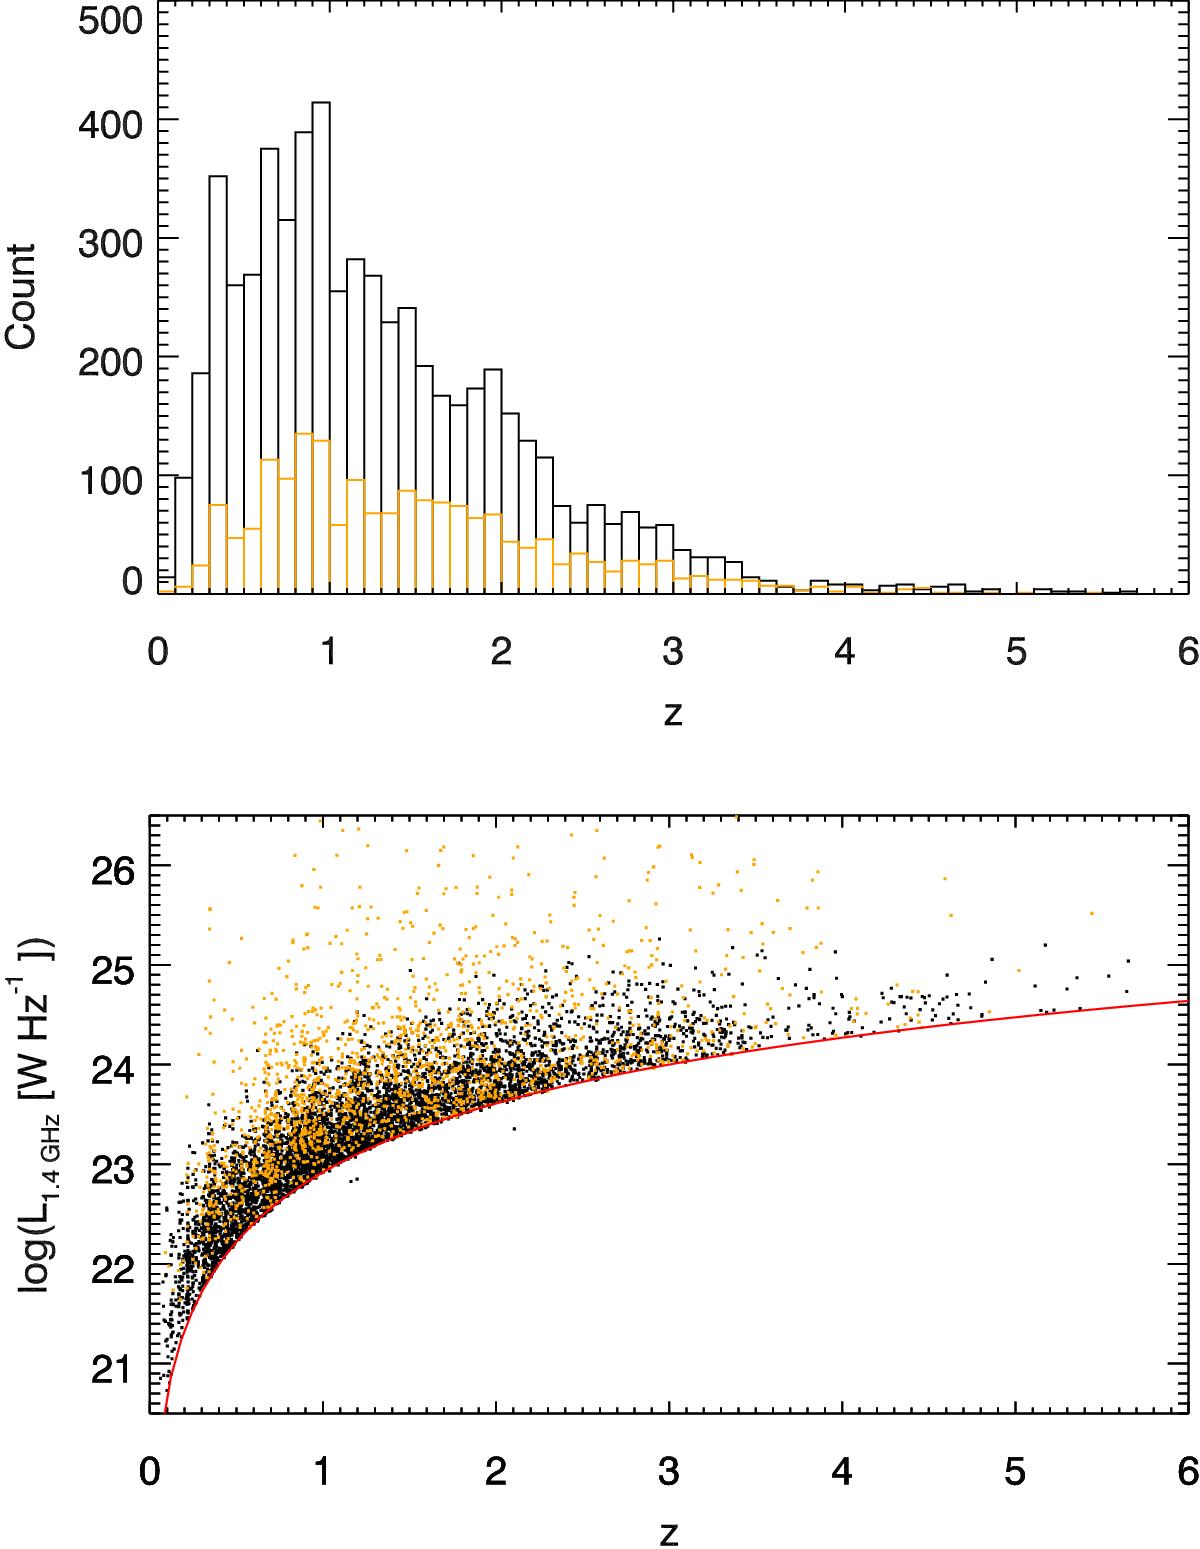
Number (top) and rest-frame 1.4 GHz luminosity (bottom) distribution of our SF (black) and radio-excess ANG (orange) galaxies as a function of redshift. The red line indicates the detection limit of 5σ, where σ = 2.3 μJy beam-1 at 3 GHz and a fixed spectral index of α = −0.7 is assumed.
This figure is made of several images, please see below:
Current usage metrics show cumulative count of Article Views (full-text article views including HTML views, PDF and ePub downloads, according to the available data) and Abstracts Views on Vision4Press platform.
Data correspond to usage on the plateform after 2015. The current usage metrics is available 48-96 hours after online publication and is updated daily on week days.
Initial download of the metrics may take a while.