Fig. 3
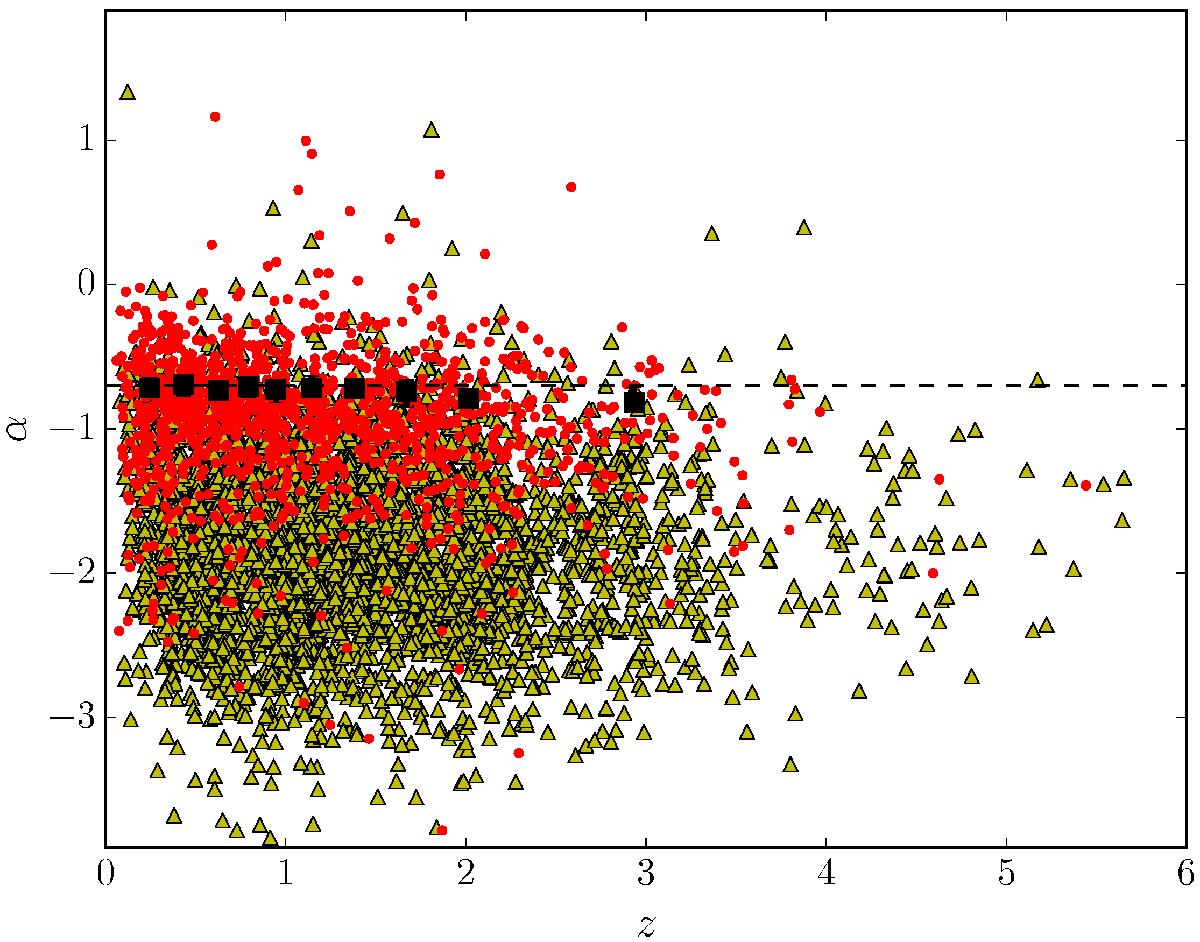
3 GHz to 1.4 GHz spectral indices (![]() ) of the star-forming population as a function of redshift. Red points show direct measurements, while yellow triangles show 5σ lower limits for objects not detected at 1.4 GHz. The median within redshift bins are shown by black squares and have been calculated using a single-censored survival analysis, which incorporates the lower limits. The median
) of the star-forming population as a function of redshift. Red points show direct measurements, while yellow triangles show 5σ lower limits for objects not detected at 1.4 GHz. The median within redshift bins are shown by black squares and have been calculated using a single-censored survival analysis, which incorporates the lower limits. The median ![]() of the star-forming population is consistent with
of the star-forming population is consistent with ![]() (indicated by the horizontal dashed line), at least at z ≲ 2.
(indicated by the horizontal dashed line), at least at z ≲ 2.
Current usage metrics show cumulative count of Article Views (full-text article views including HTML views, PDF and ePub downloads, according to the available data) and Abstracts Views on Vision4Press platform.
Data correspond to usage on the plateform after 2015. The current usage metrics is available 48-96 hours after online publication and is updated daily on week days.
Initial download of the metrics may take a while.