Fig. 21
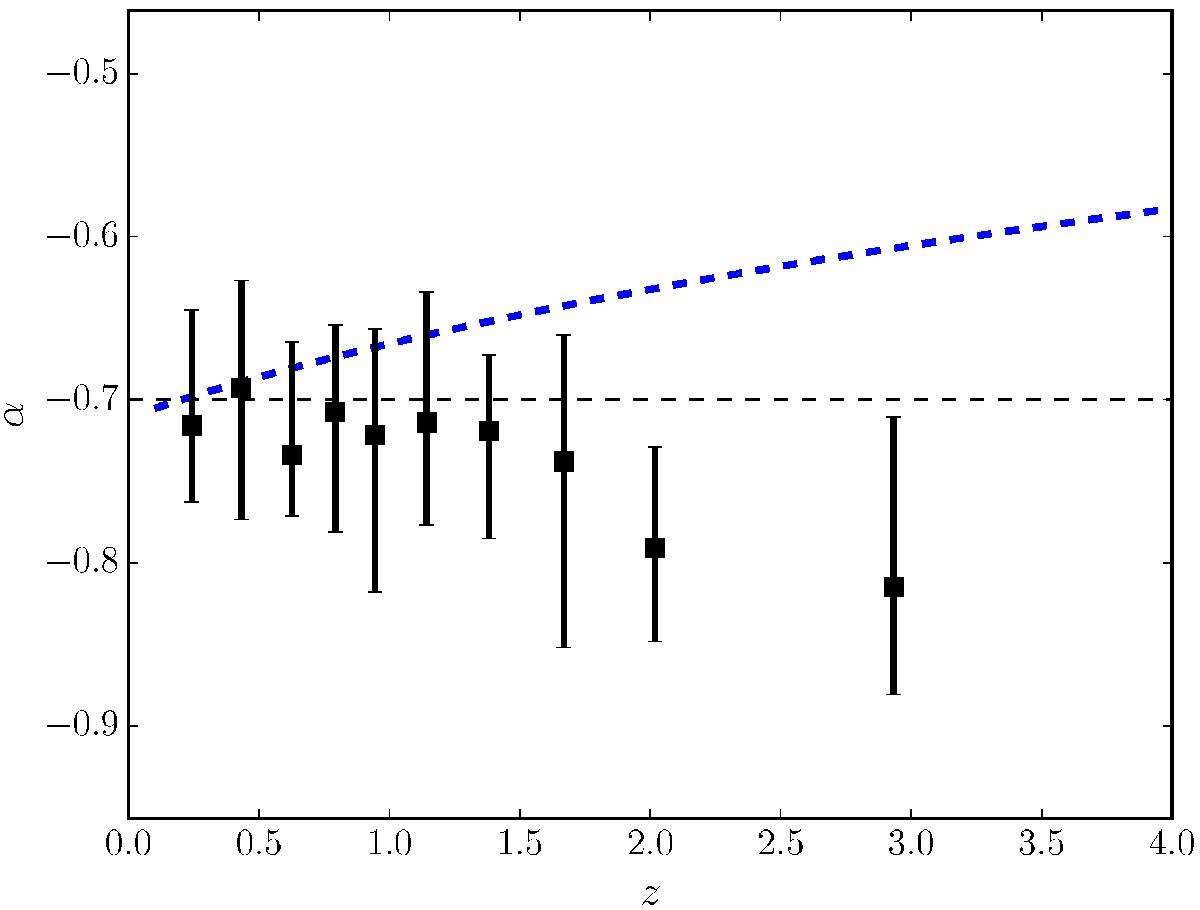
Radio spectral index (![]() ) of star-forming sources detected at 3 GHz as a function of redshift. As in Fig. 3, the median values within each redshift bin, derived from a single-censored survival analysis, are shown by the black squares. The predicted evolution in the spectral index due to the contamination of free-free emission based on the M82 model of Condon (1992) is shown by the thick, dashed blue line. Our assumed value of α = − 0.7 for non-detections at 1.4 GHz is shown by the black dashed line.
) of star-forming sources detected at 3 GHz as a function of redshift. As in Fig. 3, the median values within each redshift bin, derived from a single-censored survival analysis, are shown by the black squares. The predicted evolution in the spectral index due to the contamination of free-free emission based on the M82 model of Condon (1992) is shown by the thick, dashed blue line. Our assumed value of α = − 0.7 for non-detections at 1.4 GHz is shown by the black dashed line.
Current usage metrics show cumulative count of Article Views (full-text article views including HTML views, PDF and ePub downloads, according to the available data) and Abstracts Views on Vision4Press platform.
Data correspond to usage on the plateform after 2015. The current usage metrics is available 48-96 hours after online publication and is updated daily on week days.
Initial download of the metrics may take a while.