Fig. 1
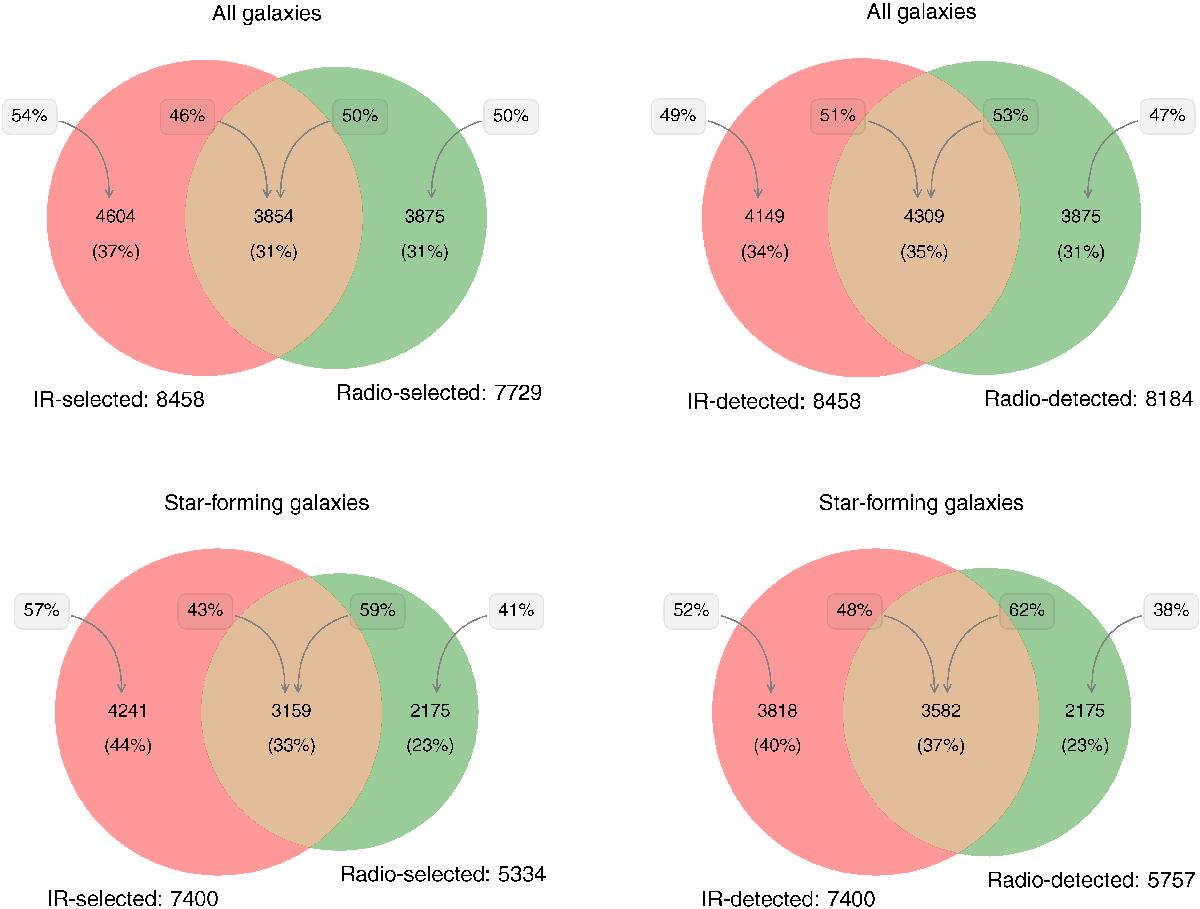
Left: number and fraction of sources present in the radio-selected and/or infrared-selected samples for: all objects in the jointly-selected sample (top), only objects classified as star-forming galaxies (bottom). The grey boxes to the left (right) in each image show the fractions relevant to the infrared- (radio-) selected sample only. Right: same as for the left but including radio detections identified in convolved 3 GHz maps. These samples therefore show which objects are detected (as opposed to selected) in the infrared and/or radio (see Sect. 2.1.3).
Current usage metrics show cumulative count of Article Views (full-text article views including HTML views, PDF and ePub downloads, according to the available data) and Abstracts Views on Vision4Press platform.
Data correspond to usage on the plateform after 2015. The current usage metrics is available 48-96 hours after online publication and is updated daily on week days.
Initial download of the metrics may take a while.