Fig. 9
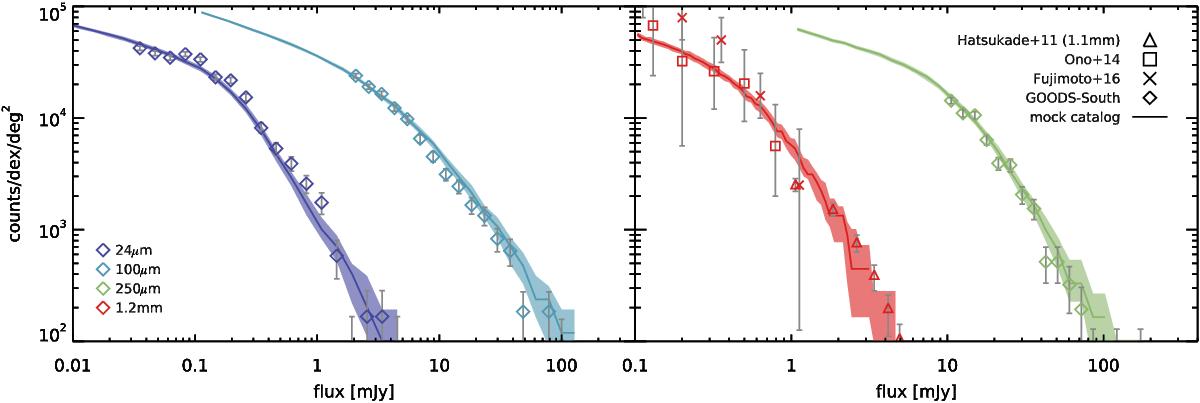
Number counts in the MIR (24 μm), FIR (100 and 250 μm) and sub-mm (1.2 mm). Additional MIR and FIR bands can be found in the appendix. The observed counts in the CANDELS fields are reported as open diamonds with Poisson error bars, and we compare these to the median counts of 100 simulated catalogs, shown with a solid line of the same color. In the background, the shaded area show the range covered between the 16th and 84th percentile of 100 simulated catalogs, to illustrate how much scatter one should expect simply due to cosmic variance. Observed counts for 24 μm are from GOODS only, since they are substantially deeper. For 1.2 mm, observations are from Ono et al. (2014) and Fujimoto et al. (2016) using ALMA 1.2 mm and Hatsukade et al. (2011) using AzTEC 1.1 mm, reported with open squares, crosses and open triangles, respectively. The 1.1 mm fluxes were scaled down by a factor 0.77 following Fujimoto et al. (2016). These observations were not done in GOODS-South, and are therefore affected by a different cosmic variance.
Current usage metrics show cumulative count of Article Views (full-text article views including HTML views, PDF and ePub downloads, according to the available data) and Abstracts Views on Vision4Press platform.
Data correspond to usage on the plateform after 2015. The current usage metrics is available 48-96 hours after online publication and is updated daily on week days.
Initial download of the metrics may take a while.