Fig. 8
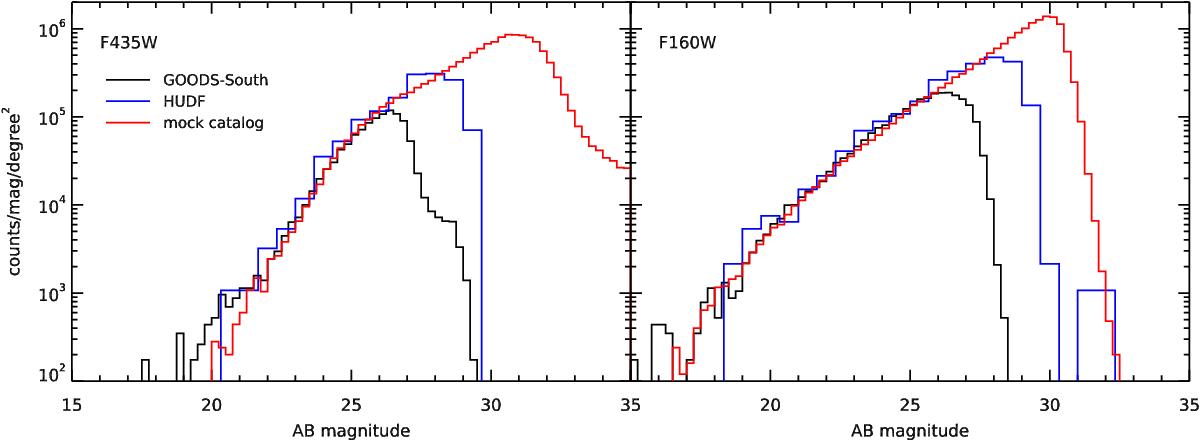
Observed magnitude distribution from the HST F435W and F160W bands (other bands can be found in the appendix). The simulated fluxes (red histogram) come from a mock field of 10′ × 10′ that is 90% complete down to H< 30. These are compared to the observed fluxes in the Hubble Ultra Deep Field (HUDF, blue) and the rest of the GOODS-South field (shallower, in black). Stars were excluded from the observed counts, since they are absent from the simulation.
Current usage metrics show cumulative count of Article Views (full-text article views including HTML views, PDF and ePub downloads, according to the available data) and Abstracts Views on Vision4Press platform.
Data correspond to usage on the plateform after 2015. The current usage metrics is available 48-96 hours after online publication and is updated daily on week days.
Initial download of the metrics may take a while.