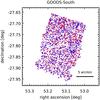
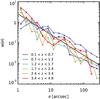
Fig. 5
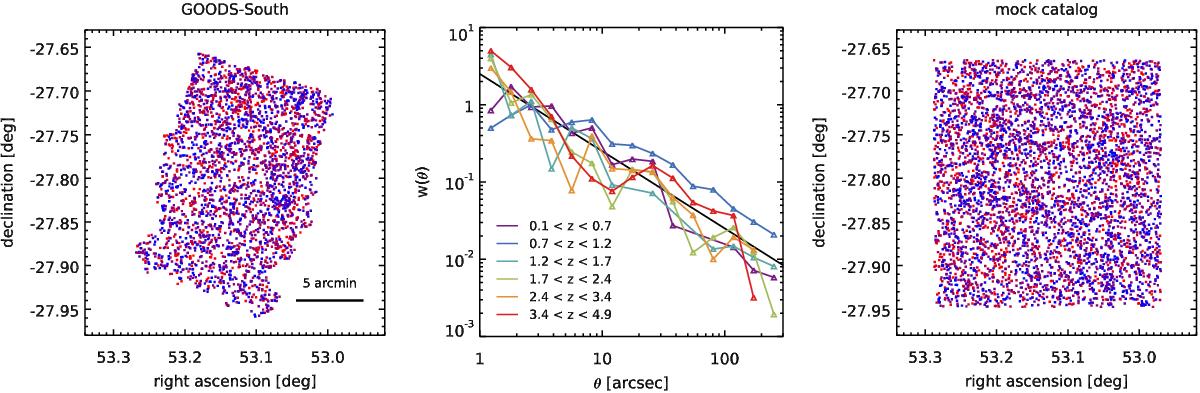
Left: sky positions of the galaxies in the GOODS-South field with H< 23. The colors indicates the redshift: blue points are z< 0.3, red points are z> 1.5, and galaxies in between are shown in shades of purple. Middle: angular two-point correlation function for GOODS-South galaxies with 9 < log 10(M∗/M⊙) < 10.3, in various redshift slices as indicated in the legend. The straight black line is a power law of index − 1. Error bars are not shown for clarity. Right: same as left, but for the mock catalog produced by EGG.
Current usage metrics show cumulative count of Article Views (full-text article views including HTML views, PDF and ePub downloads, according to the available data) and Abstracts Views on Vision4Press platform.
Data correspond to usage on the plateform after 2015. The current usage metrics is available 48-96 hours after online publication and is updated daily on week days.
Initial download of the metrics may take a while.