Fig. 3
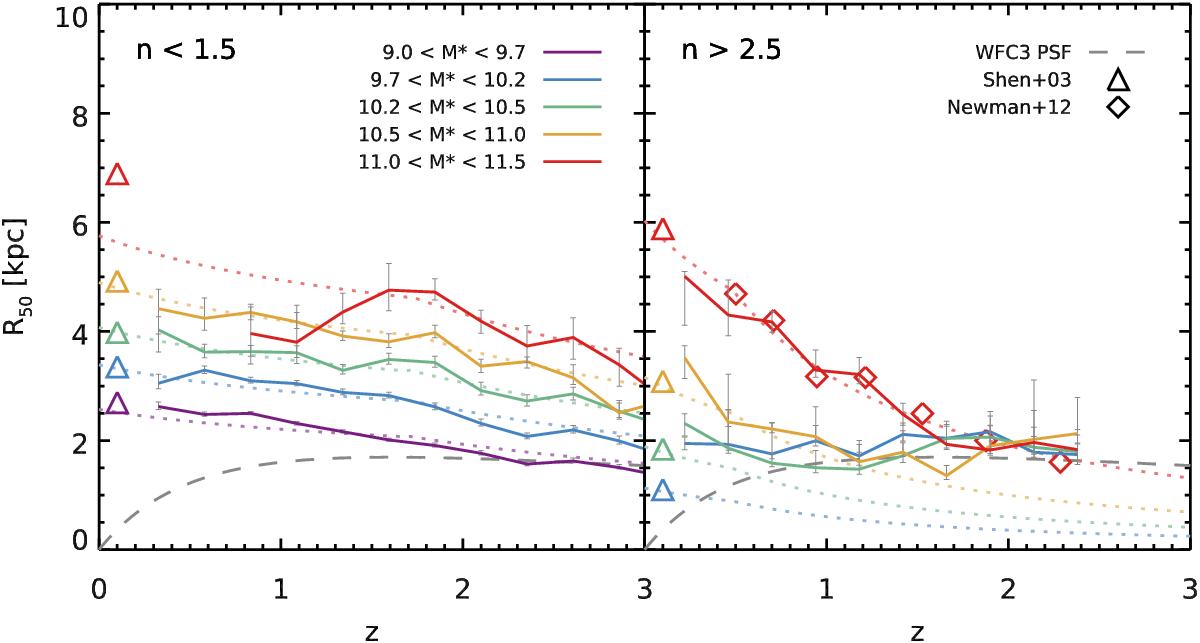
Observed relation between the half-light radius R50 (along the major axis) and redshift of disk-dominated galaxies (left) and bulge-dominated galaxies (right). Different stellar mass bins are shown with different colors as indicated in the legend. The median values over all CANDELS fields are shown with solid colored lines, error bars indicating the uncertainty on the median from bootstrapping, and the prescription adopted in this work is displayed with a dotted line in the background. We also show how the size of the HST H-band PSF (0.2″) translates into proper distance with a dashed line. Empty triangles at z = 0.1 are the values obtained by Shen et al. (2003) in the SDSS, converted from a Kroupa to a Salpeter IMF. Based on the median axis ratios we measure (Fig. 2) and following Dutton et al. (2011), we multiply the Shen et al. values by a factor 1.4 and 1.1 for disk- and bulge-dominated galaxies, respectively, to correct for the fact that their radii were measured in circularized apertures. Finally, for bulge-dominated galaxies, we also display the size measurements of Newman et al. (2012), which were obtained by selecting quiescent galaxies based on their sSFR. Their values are reported as ![]() , which we renormalize to the stellar mass of our highest mass bin.
, which we renormalize to the stellar mass of our highest mass bin.
Current usage metrics show cumulative count of Article Views (full-text article views including HTML views, PDF and ePub downloads, according to the available data) and Abstracts Views on Vision4Press platform.
Data correspond to usage on the plateform after 2015. The current usage metrics is available 48-96 hours after online publication and is updated daily on week days.
Initial download of the metrics may take a while.