Fig. 10
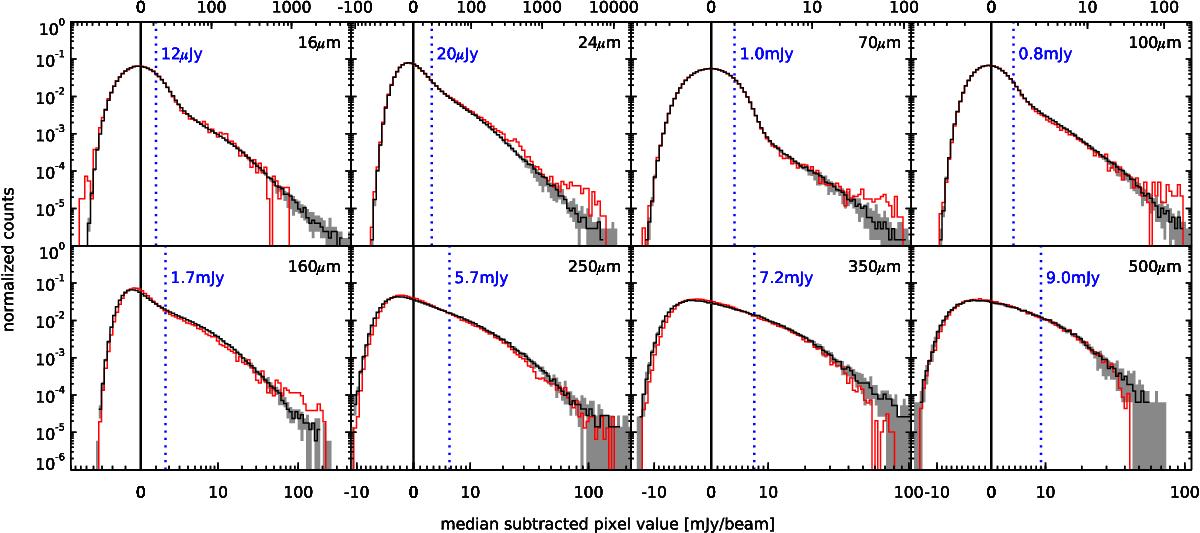
Pixel value distributions of the 16 μm to 500 μm maps, in μJy / beam for 16 and 24 μm and mJy / beam otherwise. We show the observed distribution in GOODS-South in red, and compare this reference to 100 simulated catalogs generated with different random realizations. The median of these 100 realizations is shown with a solid black line, while the range covered by the 16th and 84th percentiles is shaded in gray in the background. Each map is median-subtracted, and the pixel values displayed here are scaled using the hyperbolic arcsine function (see text). We show the location of the median of the map with a vertical solid black line, and the 3σ point-source detection limit with a vertical blue dotted line.
Current usage metrics show cumulative count of Article Views (full-text article views including HTML views, PDF and ePub downloads, according to the available data) and Abstracts Views on Vision4Press platform.
Data correspond to usage on the plateform after 2015. The current usage metrics is available 48-96 hours after online publication and is updated daily on week days.
Initial download of the metrics may take a while.