Fig. 1
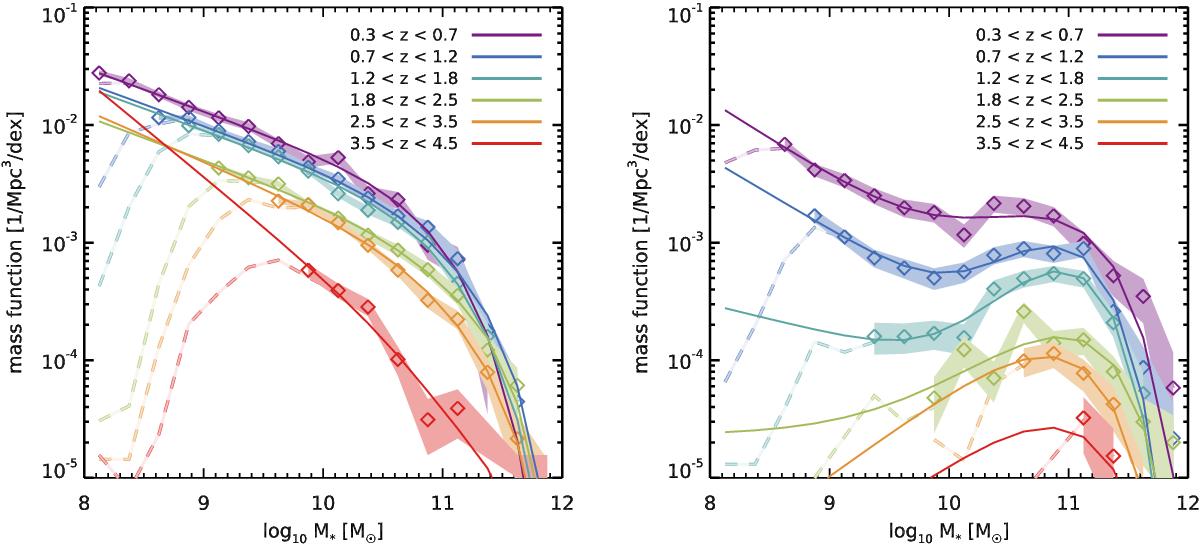
Conditional stellar mass function at different redshifts for SFGs (left) and QGs (right), selected with H< 26. The dashed lines in the background indicate the raw mass functions, before completeness corrections are applied. The solid colored regions show the completeness-corrected estimate of the mass function, and the width of the region indicates the statistical uncertainty on the measurement (i.e., Poisson noise).
Current usage metrics show cumulative count of Article Views (full-text article views including HTML views, PDF and ePub downloads, according to the available data) and Abstracts Views on Vision4Press platform.
Data correspond to usage on the plateform after 2015. The current usage metrics is available 48-96 hours after online publication and is updated daily on week days.
Initial download of the metrics may take a while.