Fig. 4
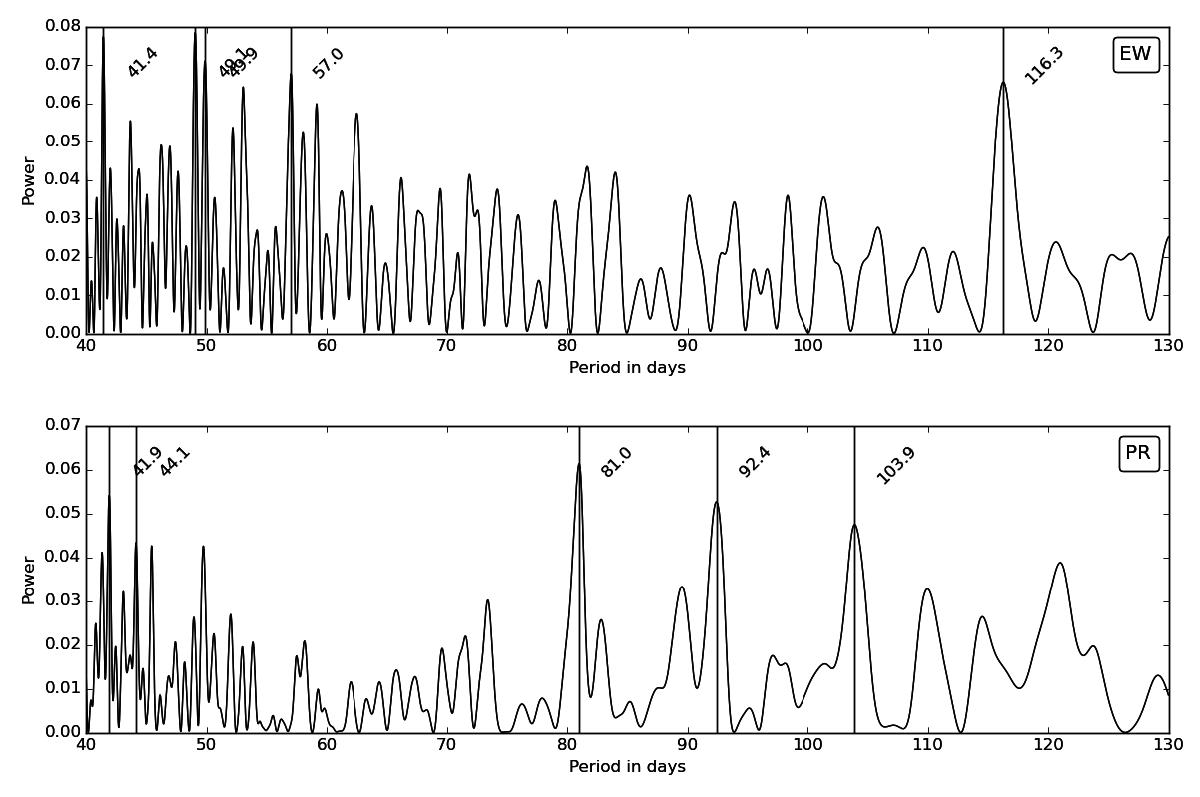
Sample periodograms from the Hα peak of the HARPS data, for the range between 40 days and 130 days in steps of 0.01 days. Top panel: periodogram derived from the equivalent widths (EW) and the bottom panels ones derived from the peak ratios (PR). None have any clipping or binning of the data. The strongest five peaks are marked on the vertical black lines.
Current usage metrics show cumulative count of Article Views (full-text article views including HTML views, PDF and ePub downloads, according to the available data) and Abstracts Views on Vision4Press platform.
Data correspond to usage on the plateform after 2015. The current usage metrics is available 48-96 hours after online publication and is updated daily on week days.
Initial download of the metrics may take a while.