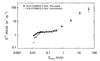
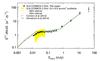
Fig. 18
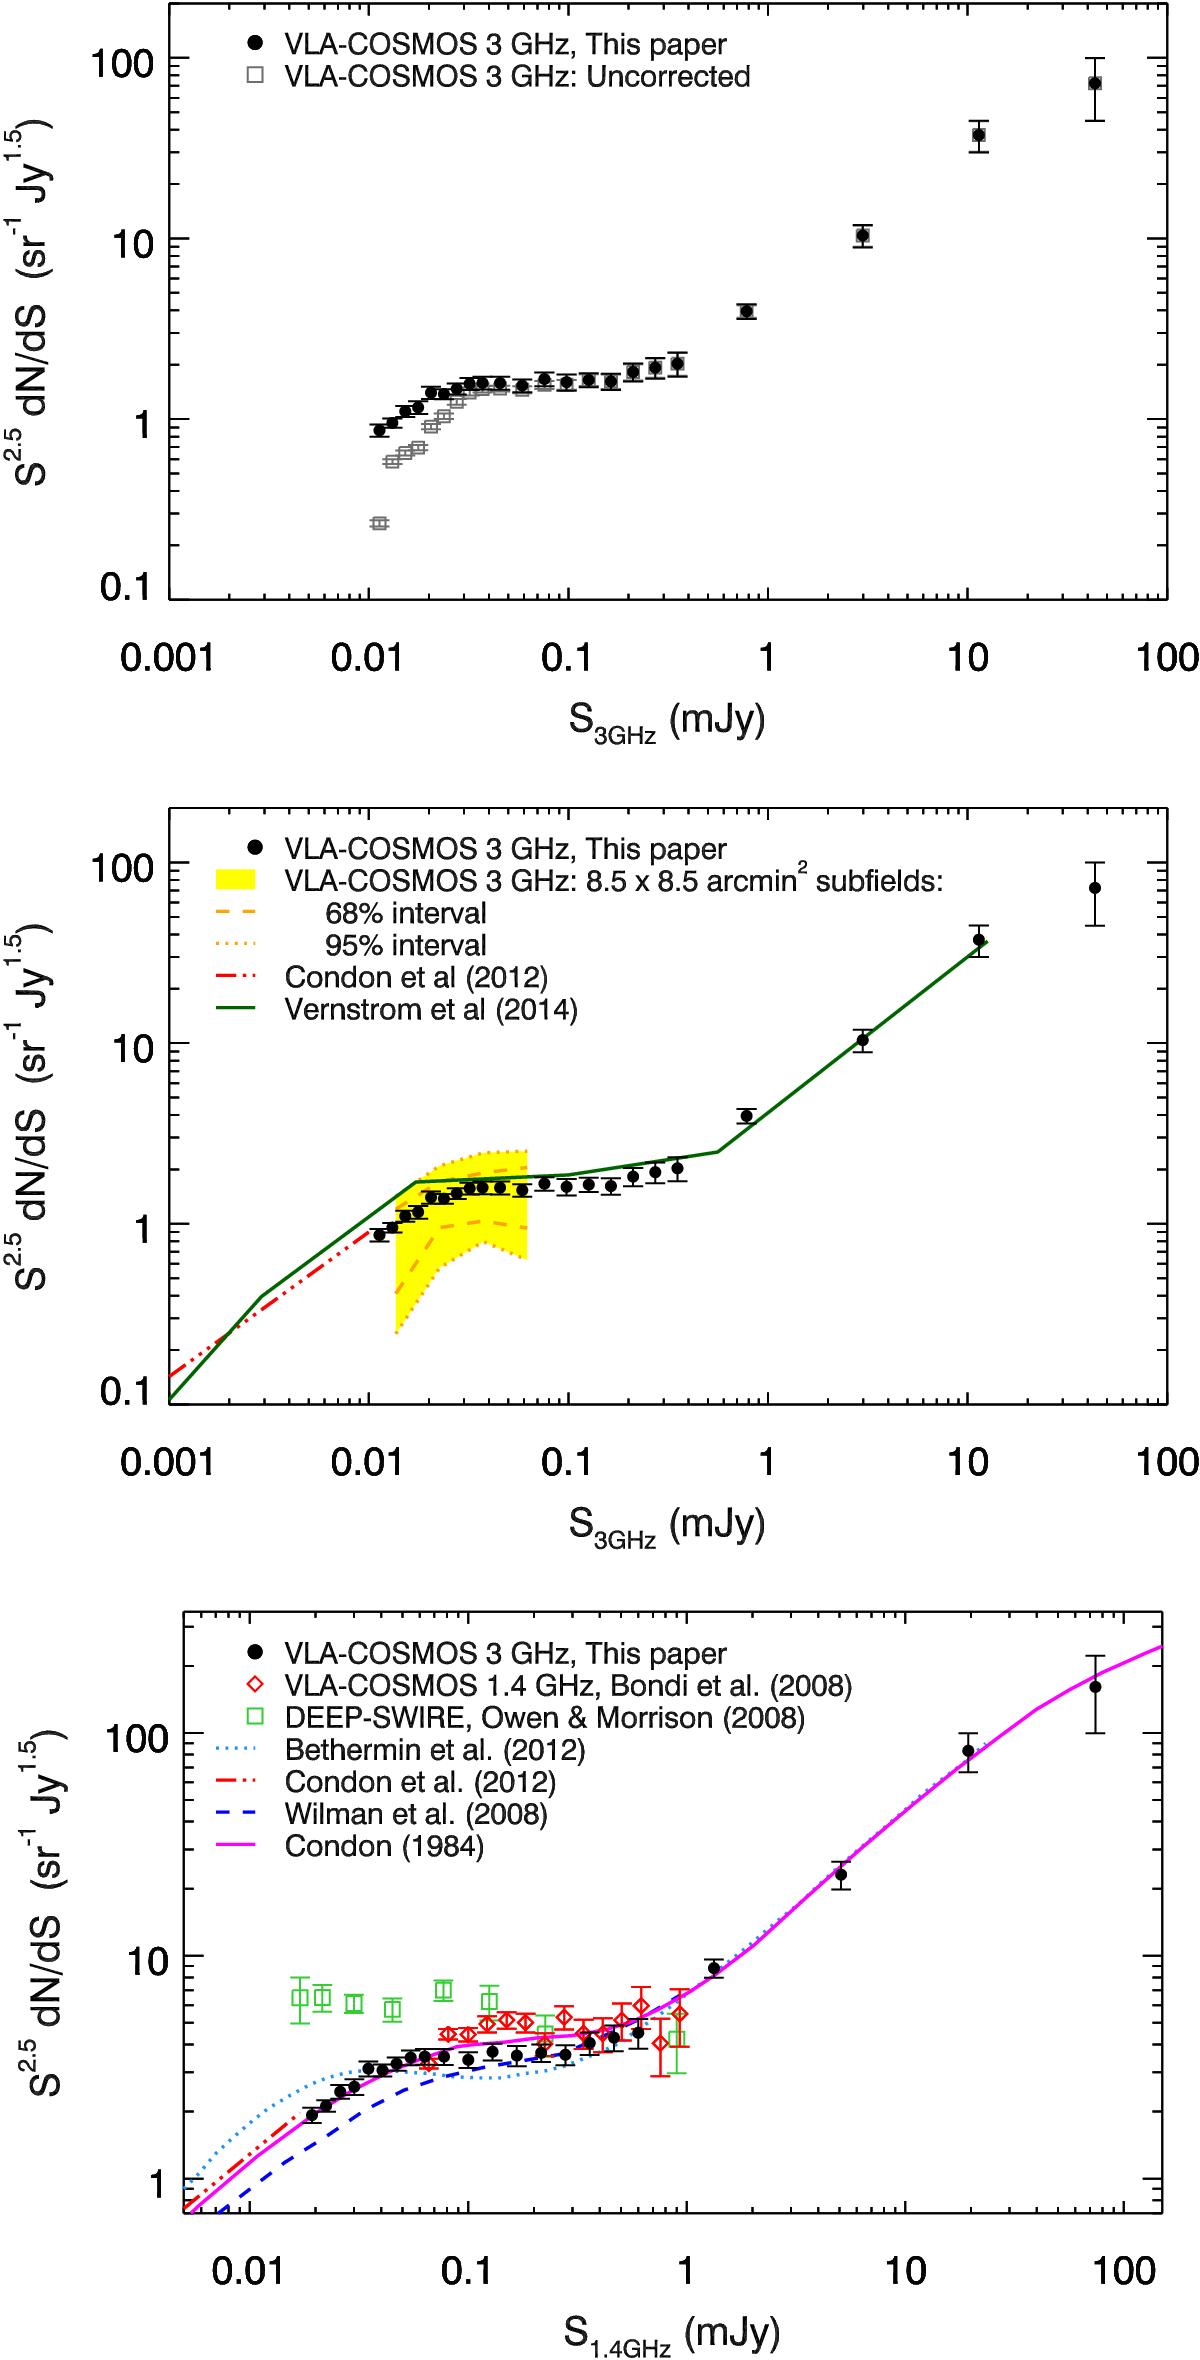
Top panel: VLA-COSMOS 3 GHz Euclidean-normalized radio source counts, corrected using the completeness and bias and false-detection correction factors (black filled points) and without corrections (gray squares). Middle panel: VLA-COSMOS 3 GHz radio source counts compared to Condon et al. (2012)P(D) analysis with a single power law (dot-dashed red line) and Vernstrom et al. (2014)P(D) analysis with multiple power laws (green line) at 3 GHz. The yellow shaded area contains 95% of different source counts obtained from 100 square and nonoverlapping (8.5 × 8.5 arcmin2) subfields of the COSMOS field, thus demonstrating the effect of cosmic variance on fields with sizes similar to those analyzed by Condon et al. (2012) and Vernstrom et al. (2014). The dashed orange line shows the 68% interval of different source counts (obtained from 16th and 84th percentile in each flux density bin). Bottom panel: counts of the same sources, but shifted to the 1.4 GHz observed frame using a spectral index of α = −0.7 prior to binning (black filled points). A selection of existing 1.4 GHz source counts in the literature is also shown, as indicated in the legend.
Current usage metrics show cumulative count of Article Views (full-text article views including HTML views, PDF and ePub downloads, according to the available data) and Abstracts Views on Vision4Press platform.
Data correspond to usage on the plateform after 2015. The current usage metrics is available 48-96 hours after online publication and is updated daily on week days.
Initial download of the metrics may take a while.