Fig. 16
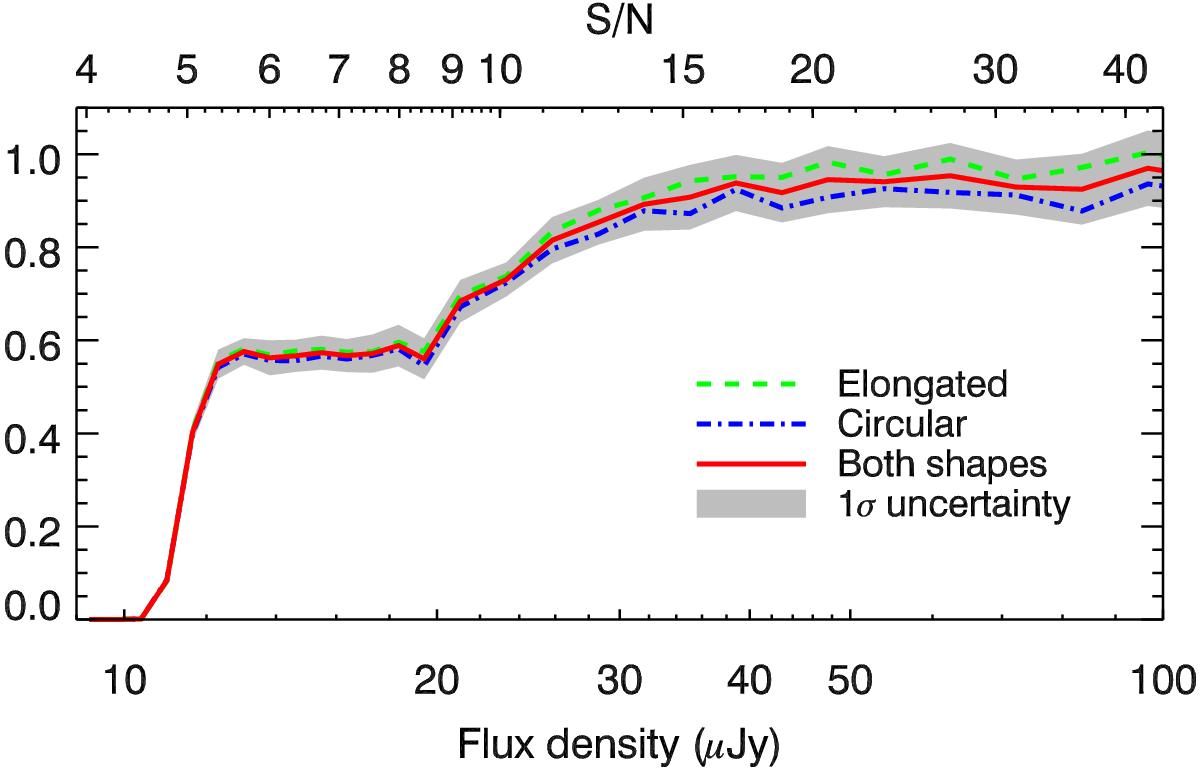
Completeness of our 3 GHz source catalog as a function of flux density and S/N. The mean completeness of all Monte Carlo runs (red line) and its standard deviation (gray shaded area) are shown. Also shown are the corrections when elongated (dash-dotted line) and circular (dashed line) geometries are assumed.
Current usage metrics show cumulative count of Article Views (full-text article views including HTML views, PDF and ePub downloads, according to the available data) and Abstracts Views on Vision4Press platform.
Data correspond to usage on the plateform after 2015. The current usage metrics is available 48-96 hours after online publication and is updated daily on week days.
Initial download of the metrics may take a while.