Fig. 14
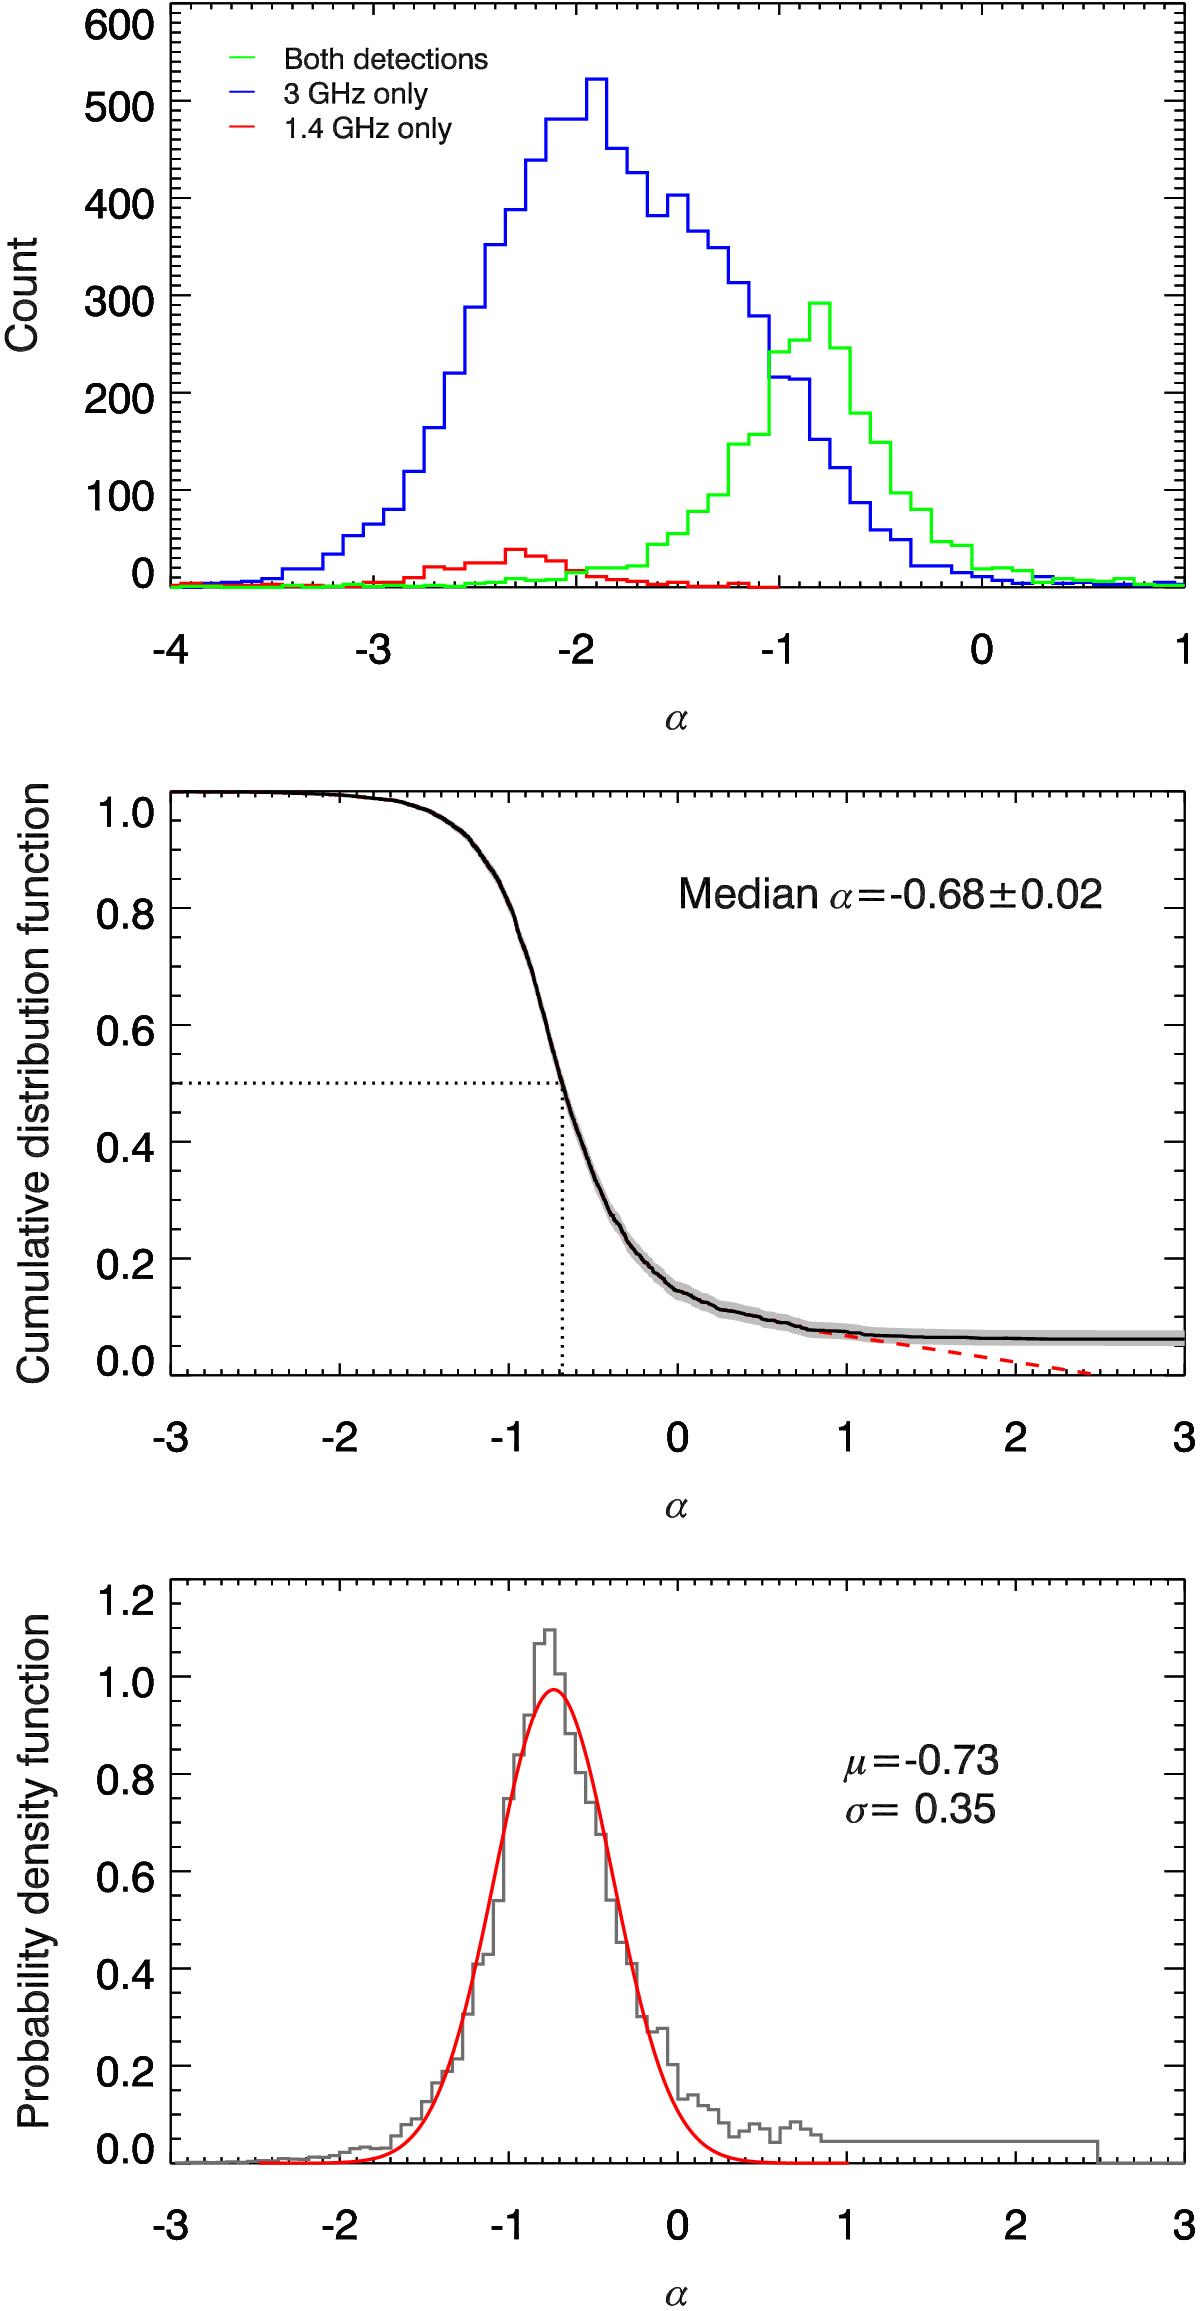
Top panel: distribution of 1.4–3 GHz spectral indices for sources detected at both frequencies (green line), and only at 3 GHz (lower limits, blue line) or 1.4 GHz (upper limits, red line). Middle panel: cumulative distribution function (CDF; black line) and error estimate (gray shaded area) of spectral indices calculated using the survival analysis also taking lower limits into account. The red dashed line shows a linear extrapolation of the distribution to zero assuming the maximum theoretically attainable spectral index of α = 2.5 (see text for details). Bottom panel: probability density function (PDF) for spectral indices calculated as a first derivative of the CDF extrapolated to 0 at high end (middle panel). A Gaussian fit to the distribution is also shown (red curve) and its mean and standard deviation are indicated in the panel.
Current usage metrics show cumulative count of Article Views (full-text article views including HTML views, PDF and ePub downloads, according to the available data) and Abstracts Views on Vision4Press platform.
Data correspond to usage on the plateform after 2015. The current usage metrics is available 48-96 hours after online publication and is updated daily on week days.
Initial download of the metrics may take a while.