Fig. 11
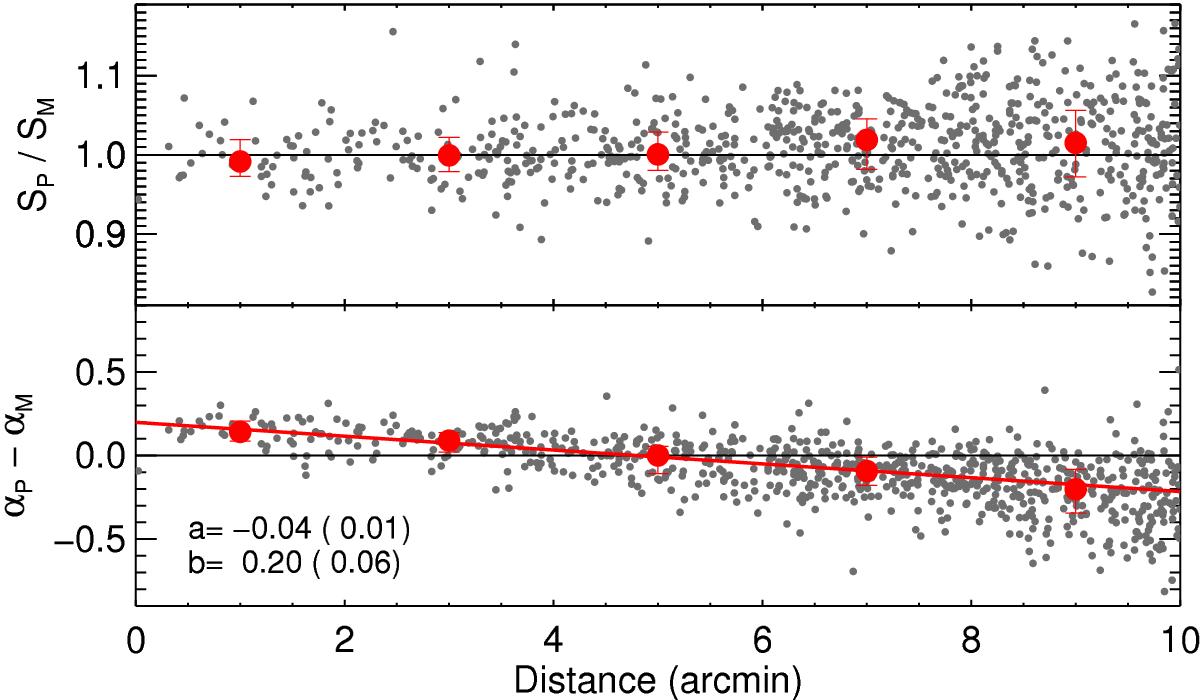
Comparison of peak surface brightnesses (top) and MSMF-based spectral indices (bottom) determined inside the mosaic (SM, αM) and individual pointings (SP, αP) as a function of distance from the pointing center for 106 bright, point-like sources (0.9 ≤ St/Sp ≤ 1.1, S/N > 200) observed in up to 11 neighboring pointings at varying distances from the pointing center (gray points). In both panels the large red points and their corresponding errors indicate median values and interquartile ranges inside 5 equally spaced distance bins. In the bottom panel a linear fit is performed on the median values to obtain the needed correction of the systematic trend across all distances (see text for details).
Current usage metrics show cumulative count of Article Views (full-text article views including HTML views, PDF and ePub downloads, according to the available data) and Abstracts Views on Vision4Press platform.
Data correspond to usage on the plateform after 2015. The current usage metrics is available 48-96 hours after online publication and is updated daily on week days.
Initial download of the metrics may take a while.