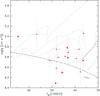
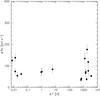
Fig. 4

Left panel: Teff−log g diagram of RV variable helium-rich sdOB and sdO stars (see Fig. 1). The size of the symbols scales with ΔRVmax. The helium main sequence (HeMS) and the HB band are superimposed with HB evolutionary tracks (dashed lines) for subsolar metallicity (log z = −1.48) from Dorman et al. (1993). The three tracks correspond to helium core masses of 0.488, 0.490 and 0.495 M⊙ (from bottom-left to top-right). Right panel: highest RV shift between individual spectra plotted against time difference between the corresponding observing epochs for helium-rich sdO and sdOB stars (see Fig. 2).
Current usage metrics show cumulative count of Article Views (full-text article views including HTML views, PDF and ePub downloads, according to the available data) and Abstracts Views on Vision4Press platform.
Data correspond to usage on the plateform after 2015. The current usage metrics is available 48-96 hours after online publication and is updated daily on week days.
Initial download of the metrics may take a while.