Fig. 2
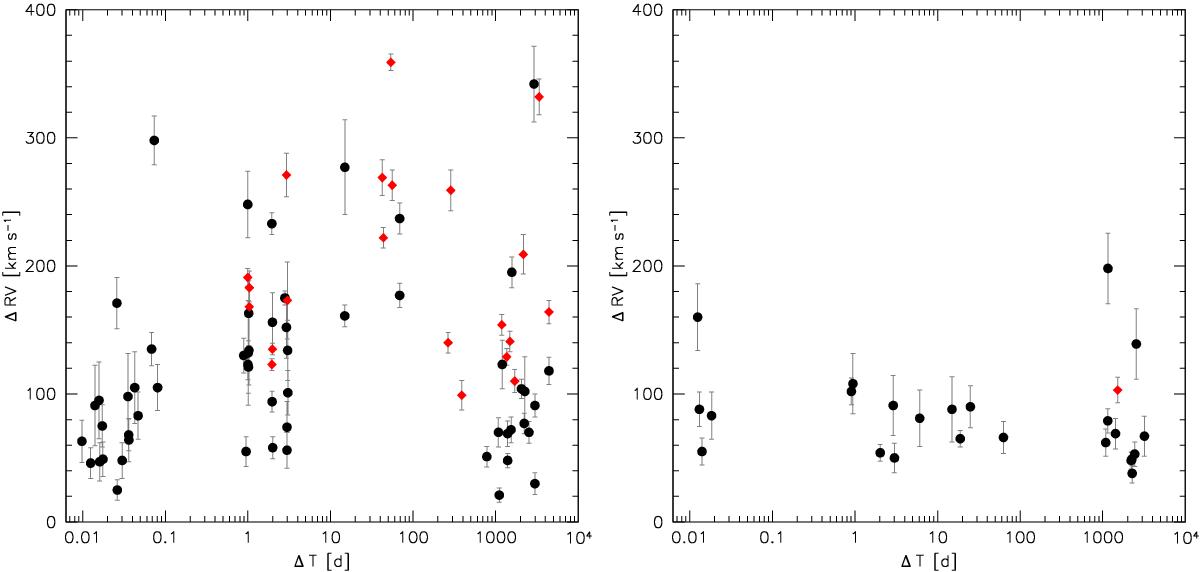
Left panel: highest RV shift between individual spectra plotted against time difference between the corresponding observing epochs. The filled red diamonds mark sdB binaries with known orbital parameters (Kupfer et al. 2015), while the filled black circles mark the rest of the hydrogen-rich sdB sample of RV variable stars. Right panel: the same plot for the hydrogen-rich sdOB and sdO sample of RV variable stars.
Current usage metrics show cumulative count of Article Views (full-text article views including HTML views, PDF and ePub downloads, according to the available data) and Abstracts Views on Vision4Press platform.
Data correspond to usage on the plateform after 2015. The current usage metrics is available 48-96 hours after online publication and is updated daily on week days.
Initial download of the metrics may take a while.