Fig. 1
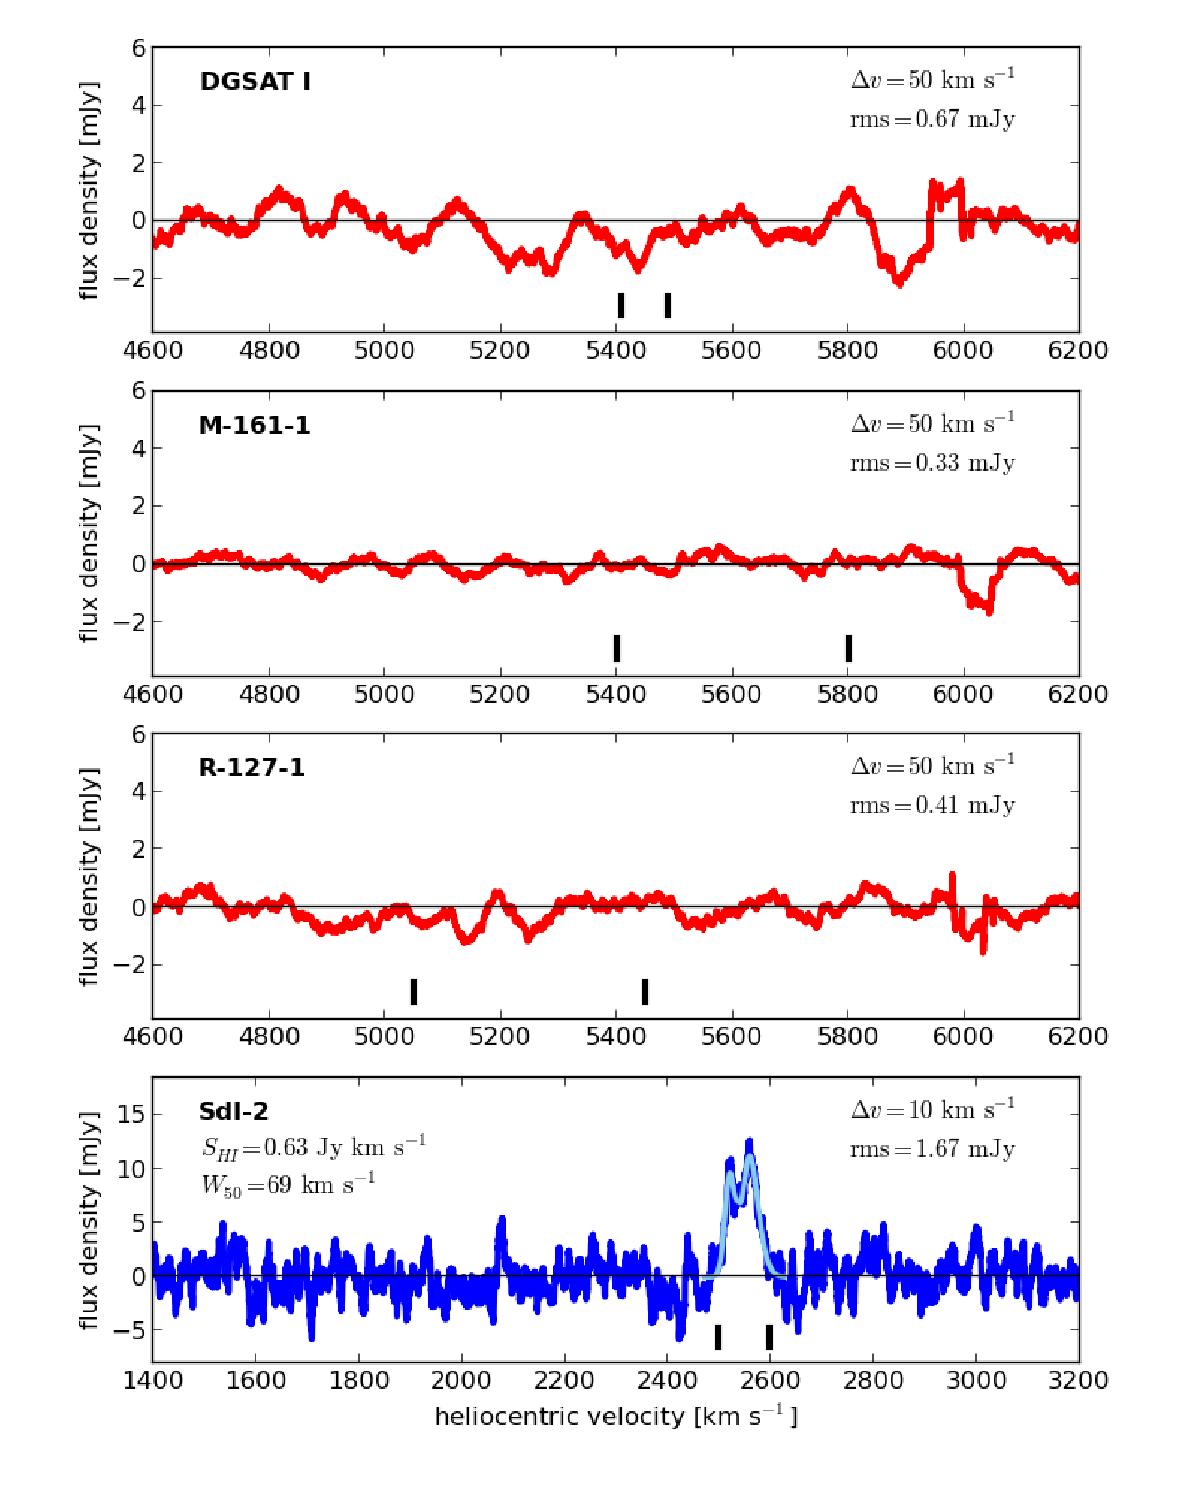
HI spectra of four isolated UDGs, obtained with the Effelsberg radio telescope. From top to bottom, the panels correspond to DGSAT I, M-161-1, R-127-1, and SdI-2. The first three spectra are non-detections. SdI-2 is instead clearly detected in the last spectrum. The light blue solid line is the best fitting generalized busy function profile (Westmeier et al. 2014). In all spectra, the short vertical lines denote the expected systemic velocity range from prior optical redshift measurements.
Current usage metrics show cumulative count of Article Views (full-text article views including HTML views, PDF and ePub downloads, according to the available data) and Abstracts Views on Vision4Press platform.
Data correspond to usage on the plateform after 2015. The current usage metrics is available 48-96 hours after online publication and is updated daily on week days.
Initial download of the metrics may take a while.