Fig. 8
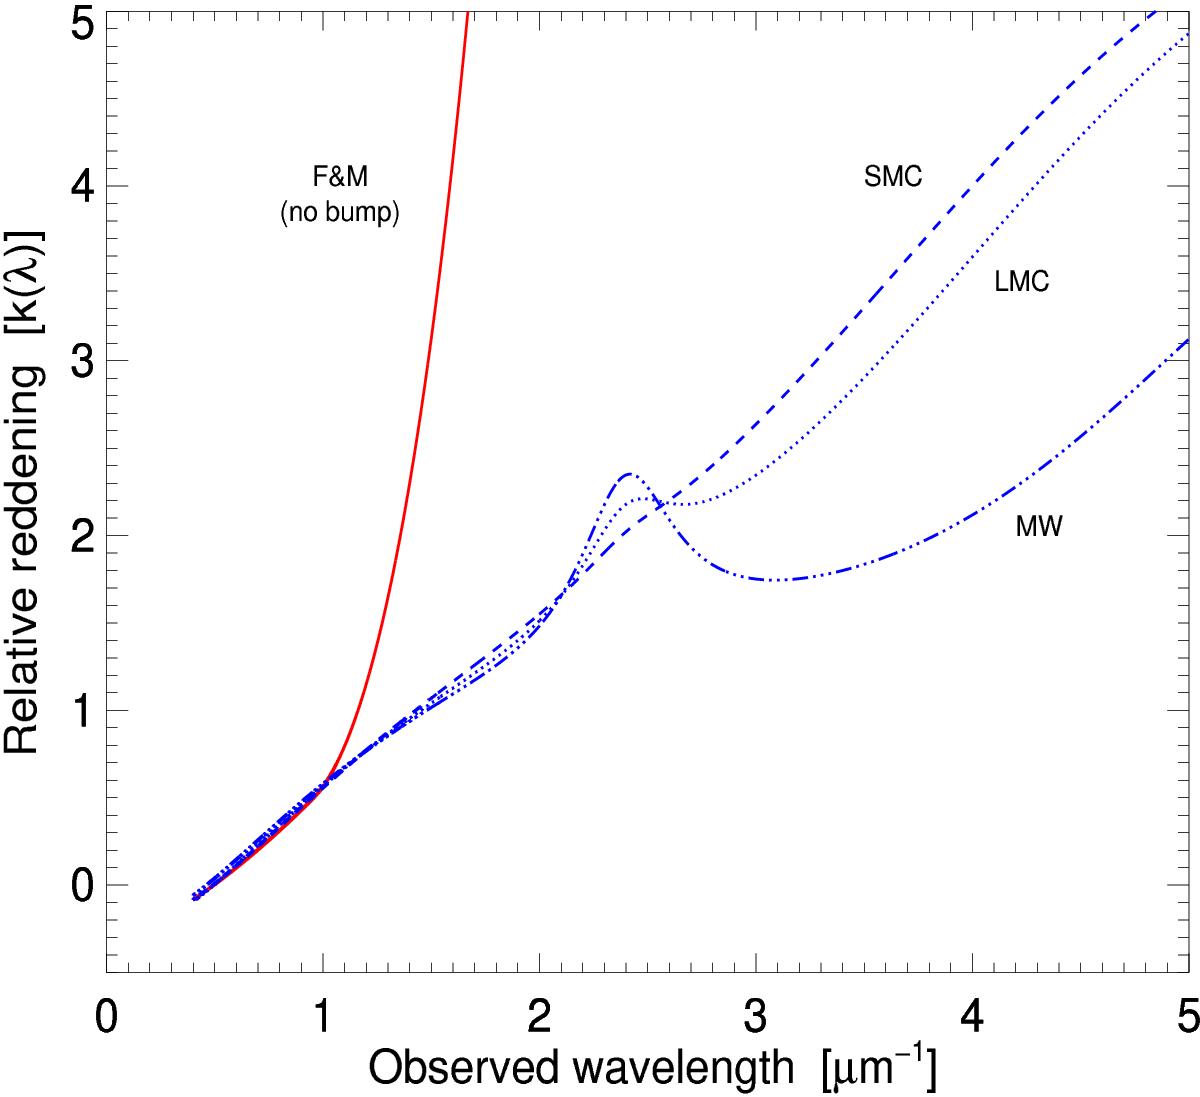
Reddening curves for the first epoch afterglow spectra with the flux of the host galaxy from the best-fit SED subtracted. Since we do not know the instrinsic brightness of the afterglow the data has been normalised to the flux in the K-band (~20 000 Å). The reddening curves, described by k(λ), thus only indicate the relative reddening and not the total extinction. It is clearly shown how the extinction curves of the Local Group, here the MW, SMC and LMC, can only match the best-fit reddening law from the Fitzpatrick & Massa (2007) parametrization at wavelengths longer than 8000 Å (observers frame), at which point the steep extinction curve diverges significantly.
Current usage metrics show cumulative count of Article Views (full-text article views including HTML views, PDF and ePub downloads, according to the available data) and Abstracts Views on Vision4Press platform.
Data correspond to usage on the plateform after 2015. The current usage metrics is available 48-96 hours after online publication and is updated daily on week days.
Initial download of the metrics may take a while.