Fig. 7
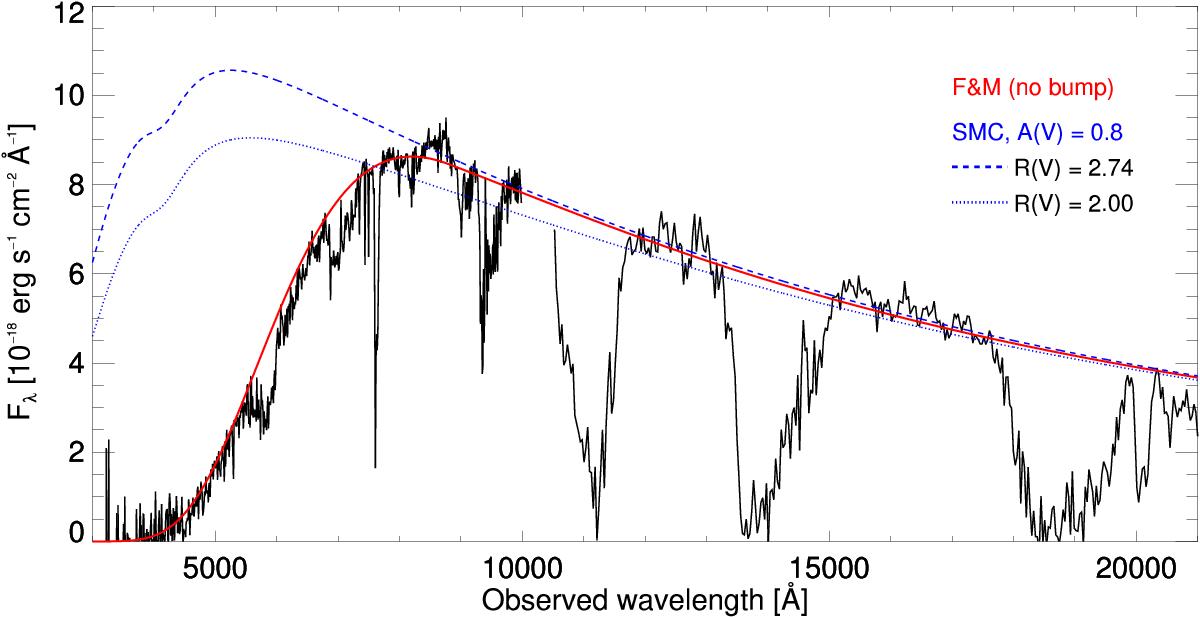
First epoch afterglow spectra with the flux of the host galaxy from the best-fit SED subtracted. Overplotted is the best-fit Fitzpatrick & Massa (2007) parametrization of the extinction curve with c3 = 0 (no bump) shown by the red solid line. We assume an underlying power-law with slope set by a fit to the X-ray afterglow and assuming a Δβ = 0.5 cooling break between the X-rays and the optical. Regions affected by telluric absorption are removed from the fit. Also plotted is the extinction curve of the SMC as described by Gordon et al. (2003); blue dashed line) and with an decreased total-to-selective reddening, RV (blue dotted line). These examples proves to show that the extinction can not simply be modelled by a standard or even steeper SMC-type reddening law. The parameters of the best-fit extinction curve diverges significantly from that known from the local analogs, most notable are the c4 and c5 values representing the far-UV curvature component, but also the flat value of RV. These are required to model the extreme drop without assuming a bump in the extinction curve in combination with the otherwise blue spectrum.
Current usage metrics show cumulative count of Article Views (full-text article views including HTML views, PDF and ePub downloads, according to the available data) and Abstracts Views on Vision4Press platform.
Data correspond to usage on the plateform after 2015. The current usage metrics is available 48-96 hours after online publication and is updated daily on week days.
Initial download of the metrics may take a while.