Free Access
Fig. 5
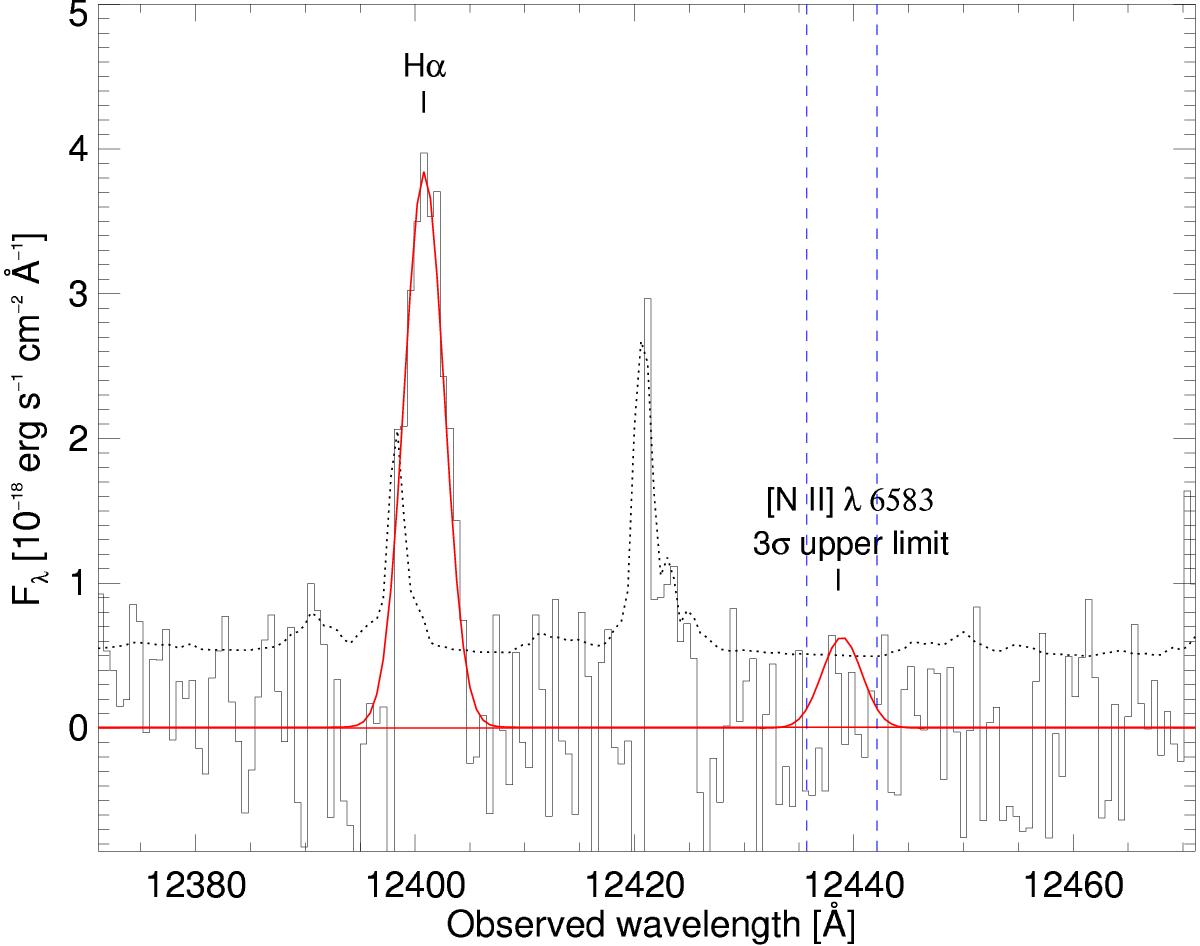
The 3σ flux limit of [N ii] measured from the continuum compared to Hα. We assumed a Gaussian shape of the line profile and measured the limit at the FWHM (dashed blue lines) of that of Hα. The total flux of the continuum at [N ii] was then computed from the flux encompassed in this region.
Current usage metrics show cumulative count of Article Views (full-text article views including HTML views, PDF and ePub downloads, according to the available data) and Abstracts Views on Vision4Press platform.
Data correspond to usage on the plateform after 2015. The current usage metrics is available 48-96 hours after online publication and is updated daily on week days.
Initial download of the metrics may take a while.