Fig. 3
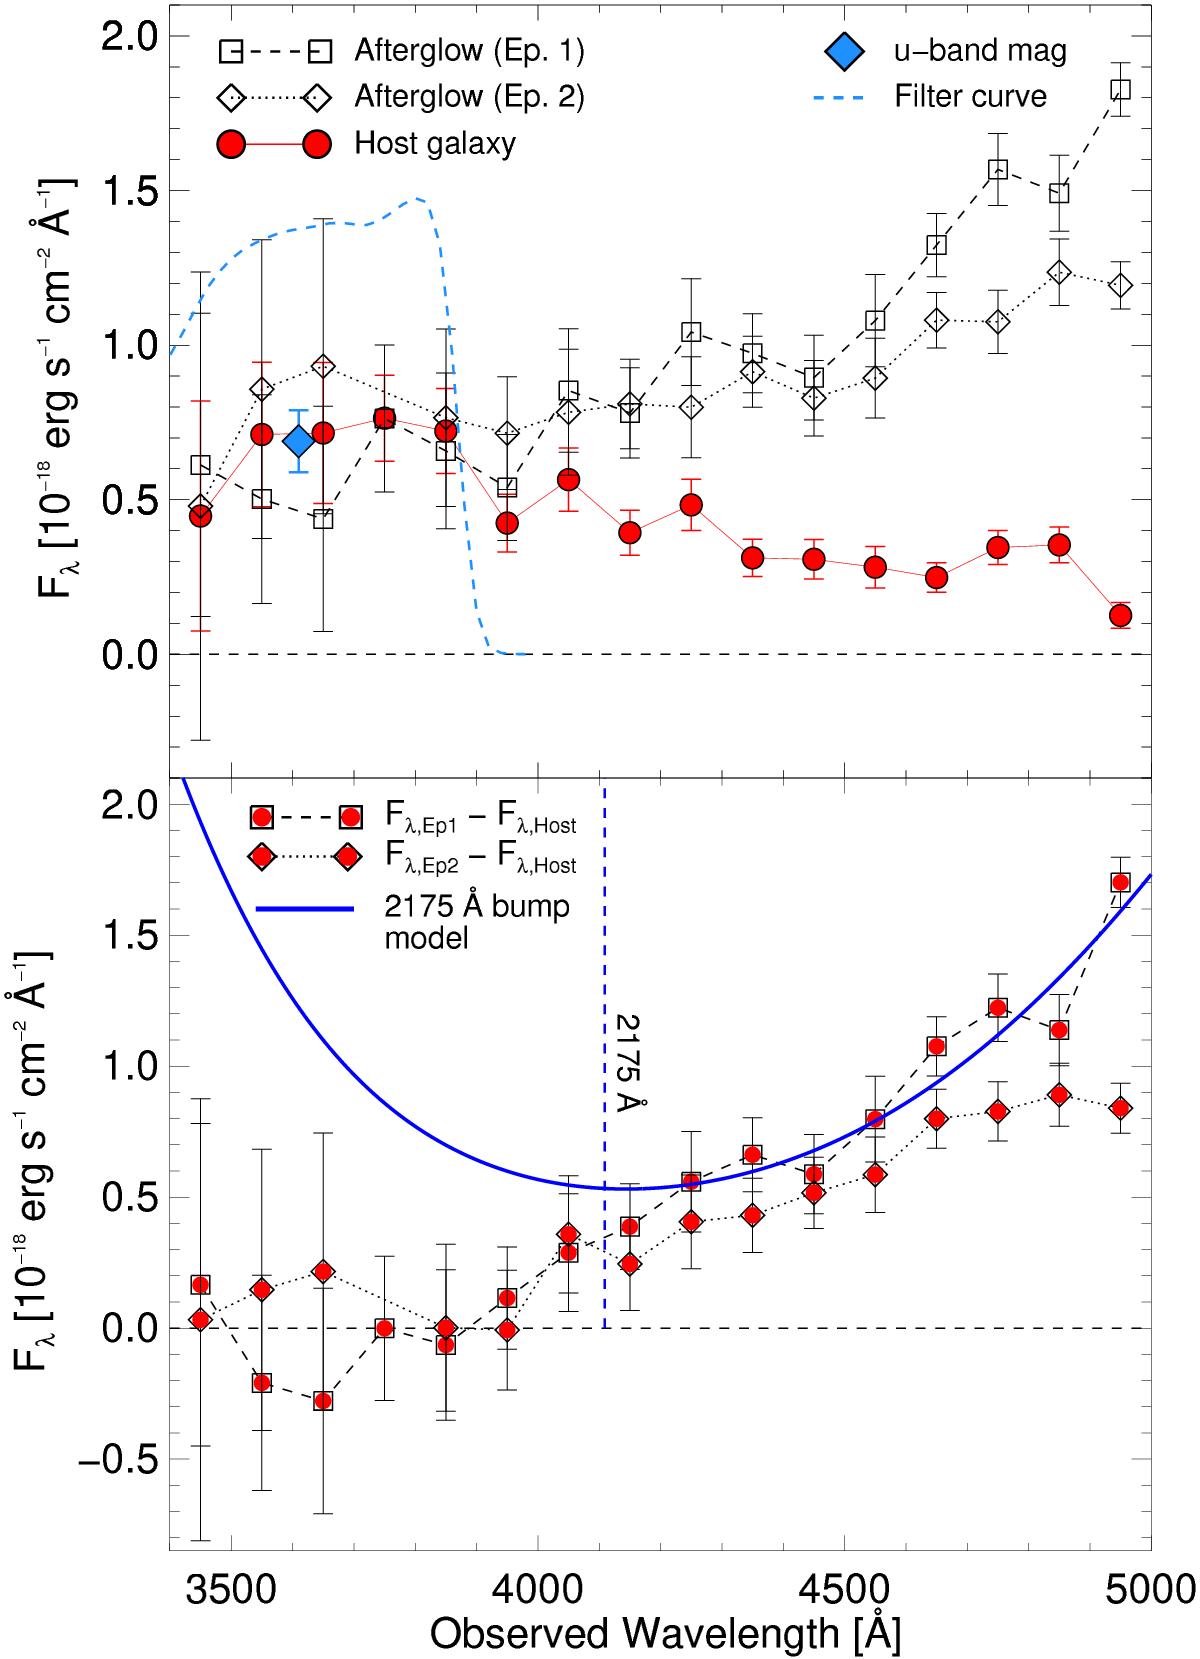
Top panel: comparison of the spectra of the first and second epoch afterglow and the spectrum of the host galaxy at λ< 5000 Å, each binned by 100 Å, together with the measured VLT/FORS2 u-band magnitude of the host. The consistent lower flux in the first epoch afterglow spectrum below 4000 Å is due to the host galaxy being partly outside of the slit (see Fig. 2). Bottom panel: first and second epoch afterglow spectra with the flux of the host galaxy subtracted. Overplotted is the 2715 Å extinction bump model from Fynbo et al. (2014), which can now be securely excluded as the scenario causing the steep extinction.
Current usage metrics show cumulative count of Article Views (full-text article views including HTML views, PDF and ePub downloads, according to the available data) and Abstracts Views on Vision4Press platform.
Data correspond to usage on the plateform after 2015. The current usage metrics is available 48-96 hours after online publication and is updated daily on week days.
Initial download of the metrics may take a while.