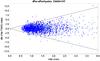
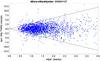
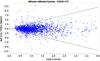
Fig. 8

Differences in astrometric parameters as a function of the su of the differences between the Hipparcos and TGAS solutions for stars, as measured in a field of 18° radius centred on the Hyades cluster. The blue dots represent clean 5-parameter solutions in the Hipparcos data. The red dots represent primarily accelerated solutions (so-called 7 and 9 parameter solutions). The green dots were solved as double stars in the Hipparcos solution. The two black lines show the ± 3σsu levels. From top to bottom: parallaxes, proper motions in right ascension, proper motion in declination.
Current usage metrics show cumulative count of Article Views (full-text article views including HTML views, PDF and ePub downloads, according to the available data) and Abstracts Views on Vision4Press platform.
Data correspond to usage on the plateform after 2015. The current usage metrics is available 48-96 hours after online publication and is updated daily on week days.
Initial download of the metrics may take a while.