Fig. 2
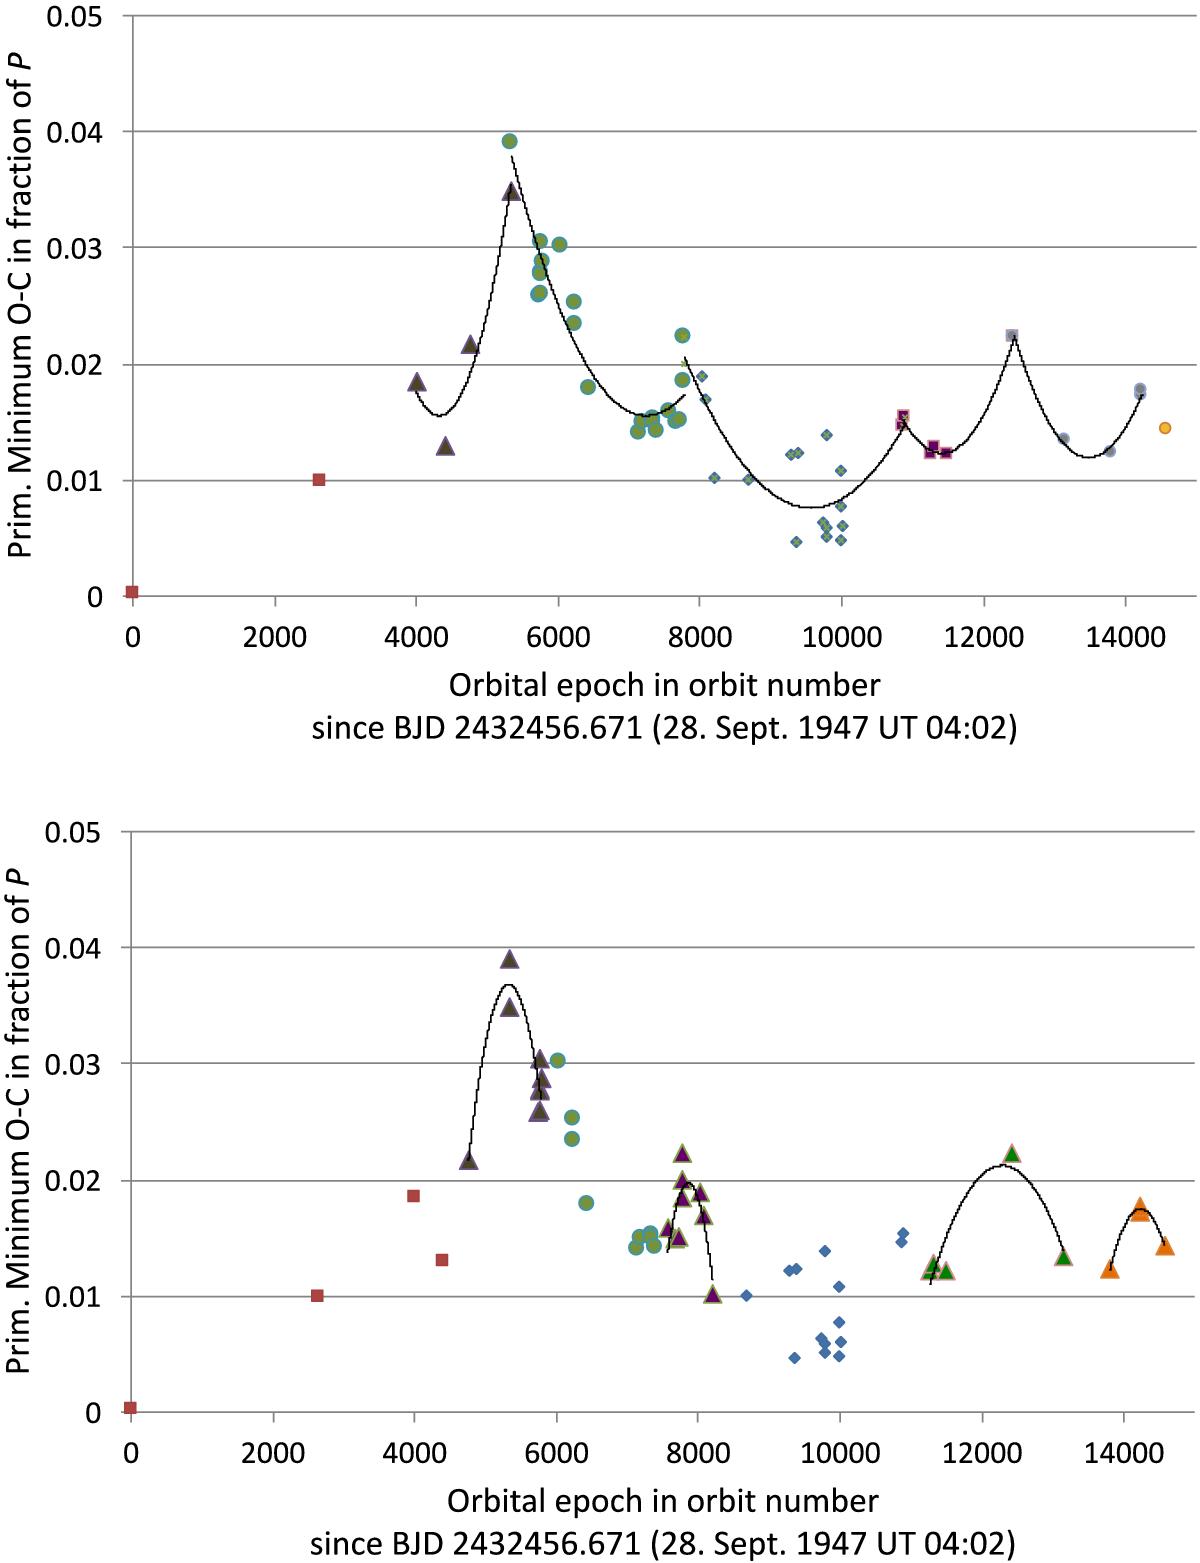
Same as previous figure only that here we illustrate the quadratic fits to portions of the data that display strong variations. Top: fits with positive quadratic coefficients. Bottom: fits with negative quadratic coefficients. (see Table 2 for the corresponding values). Different symbols indicate the O−C values that were used to derive each parabolic fit reported in Table 1.
Current usage metrics show cumulative count of Article Views (full-text article views including HTML views, PDF and ePub downloads, according to the available data) and Abstracts Views on Vision4Press platform.
Data correspond to usage on the plateform after 2015. The current usage metrics is available 48-96 hours after online publication and is updated daily on week days.
Initial download of the metrics may take a while.