Fig. 7
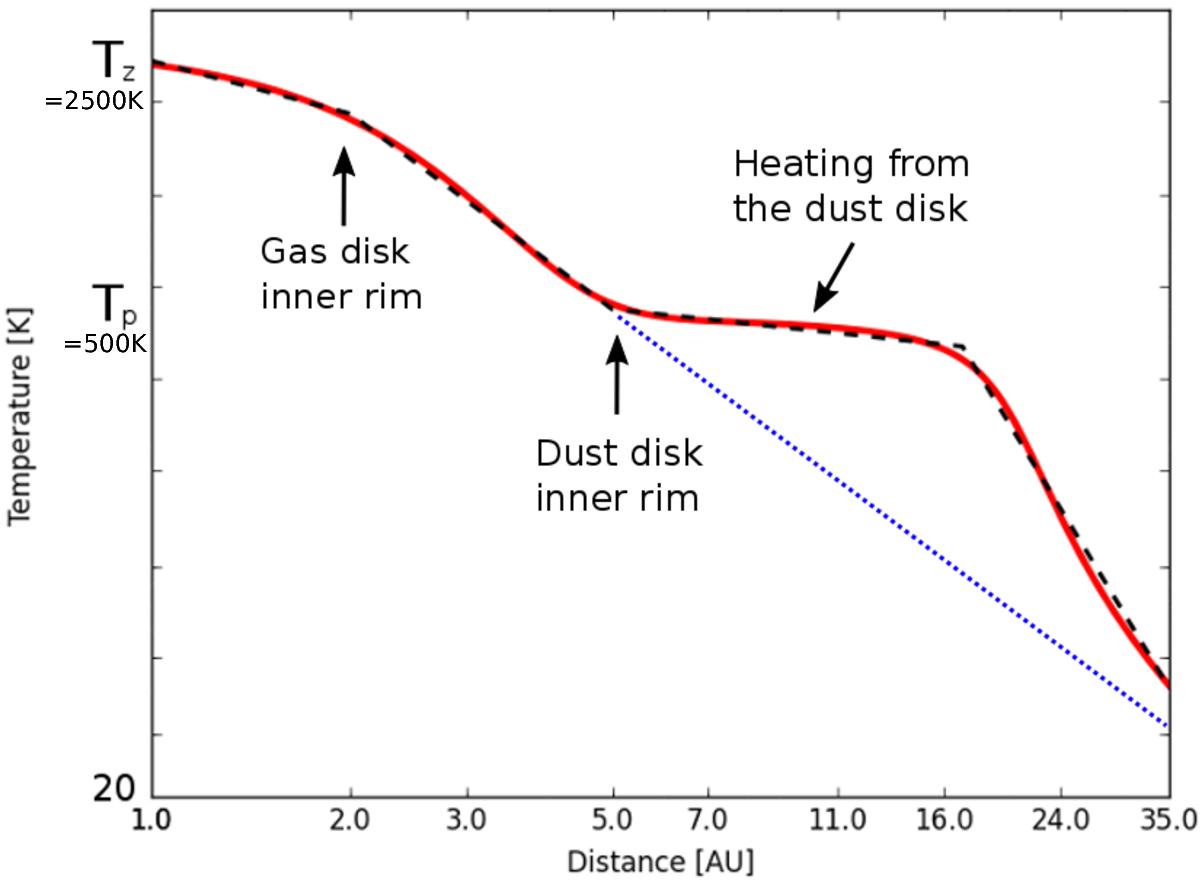
Logarithmic plot of the radial temperature profile used to model the 12CO disk surrounding L2 Pup, as a function of distance from the central star. The red line represents the continuous expression. The black dotted line is the closest approximation of the red curve by a set of subsequent power laws. The blue dotted line continues the temperature trend of the gas, devoid of dust. The temperature parameter values, and the slopes of the power laws are listed in Table 5.
Current usage metrics show cumulative count of Article Views (full-text article views including HTML views, PDF and ePub downloads, according to the available data) and Abstracts Views on Vision4Press platform.
Data correspond to usage on the plateform after 2015. The current usage metrics is available 48-96 hours after online publication and is updated daily on week days.
Initial download of the metrics may take a while.