Fig. A.1
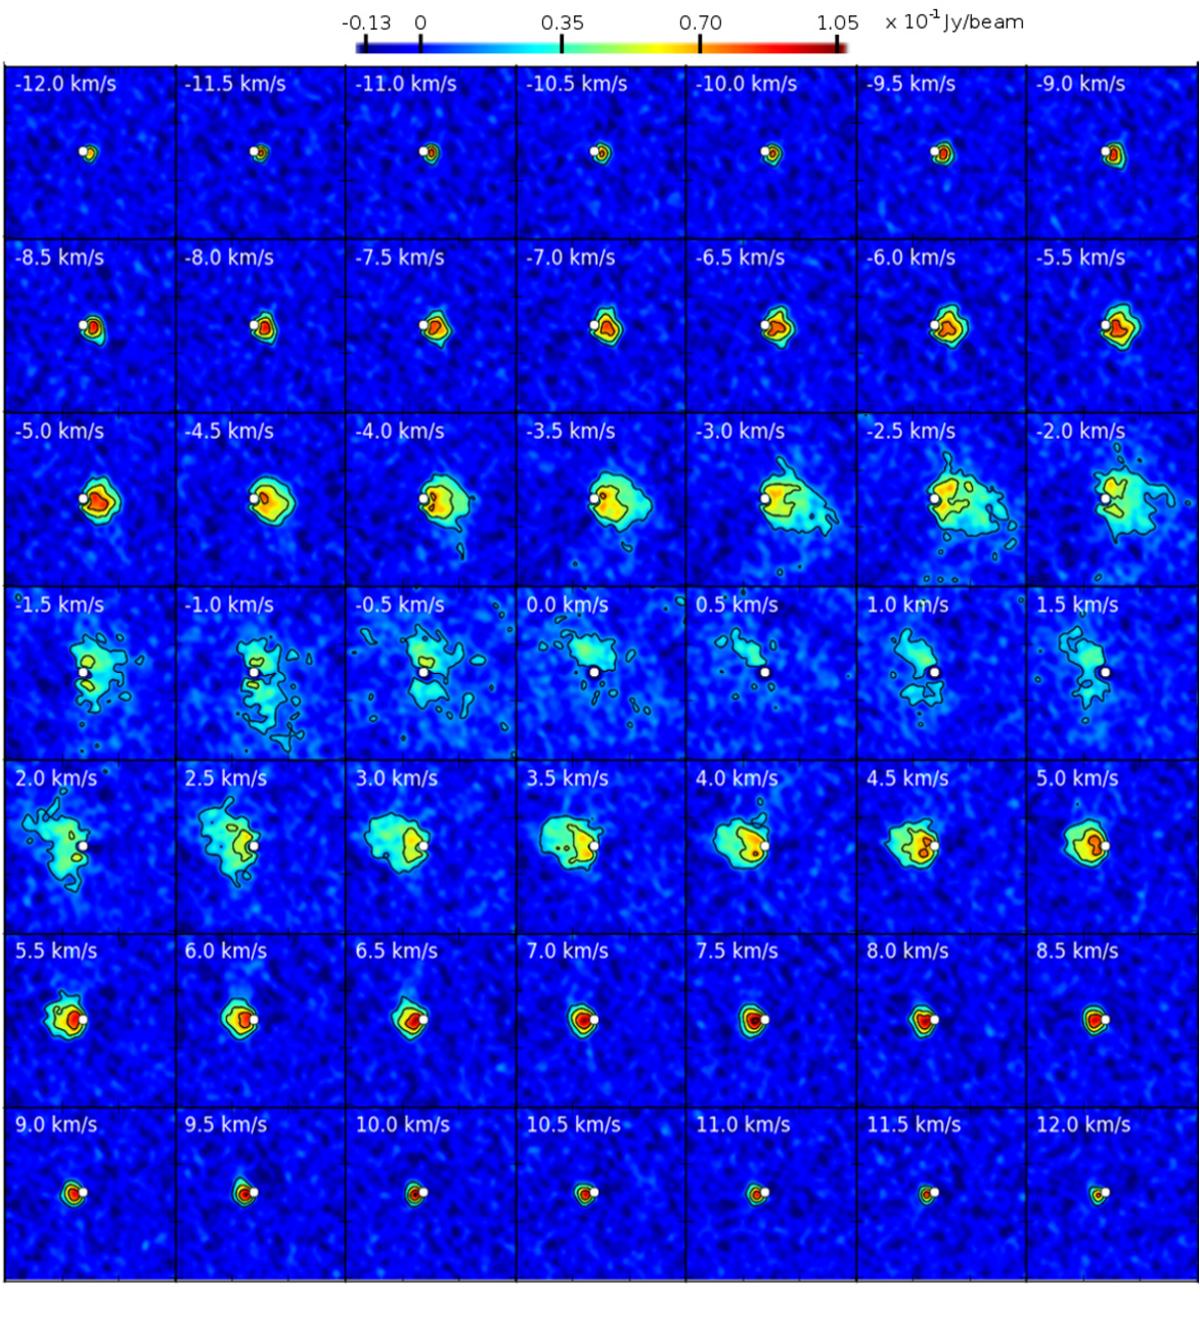
Visualisation of the velocity channel maps of the 12CO J = 3−2 emission of the circumstellar environment of L2 Pup with the continuum subtracted. Each panel has a dimension of 1′′ by 1′′. The velocity channel is indicated in the top left corner of each panel. The black contour levels are drawn every 7 times the rms noise value outside the line. The white dot represents the location of the centre of mass.
Current usage metrics show cumulative count of Article Views (full-text article views including HTML views, PDF and ePub downloads, according to the available data) and Abstracts Views on Vision4Press platform.
Data correspond to usage on the plateform after 2015. The current usage metrics is available 48-96 hours after online publication and is updated daily on week days.
Initial download of the metrics may take a while.