Fig. 1
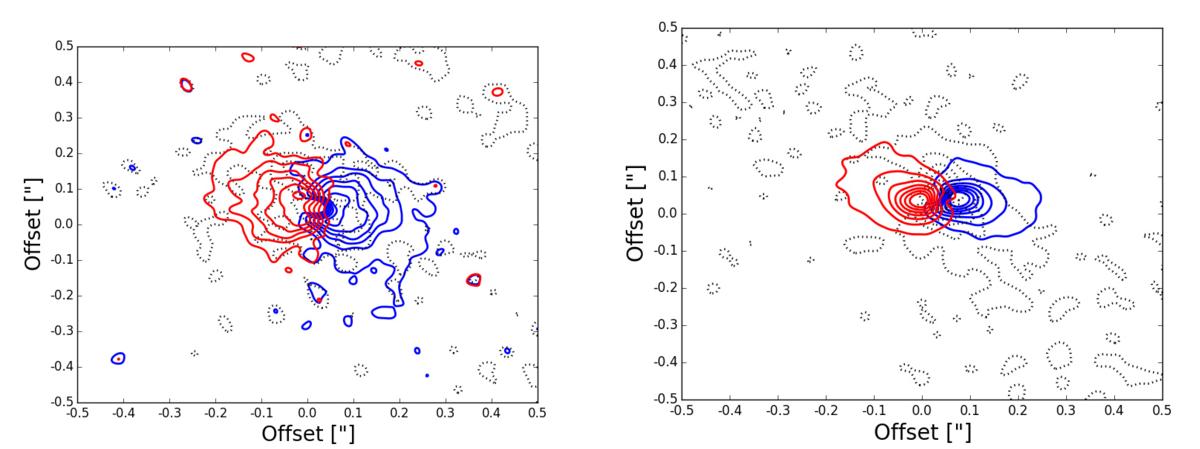
Stereogram view of the continuum subtracted 12CO J = 3−2 (left panel) and 13CO J = 3−2 (right panel) data. The blue (red) contours correspond to the velocity-averaged emission profile of 98% of the blue-shifted (red-shifted) wing of line. The black dashed contours correspond to the velocity-averaged emission of the central 2% of the emission line. The contours are drawn at every 2.5 times the continuum rms noise value (12CO: 2.5 mJybeam-1, 13CO: 2.6 mJy beam-1). This figure appeared in Kervella et al. (2016), and is repeated here as a guide.
Current usage metrics show cumulative count of Article Views (full-text article views including HTML views, PDF and ePub downloads, according to the available data) and Abstracts Views on Vision4Press platform.
Data correspond to usage on the plateform after 2015. The current usage metrics is available 48-96 hours after online publication and is updated daily on week days.
Initial download of the metrics may take a while.