Free Access
Fig. 8
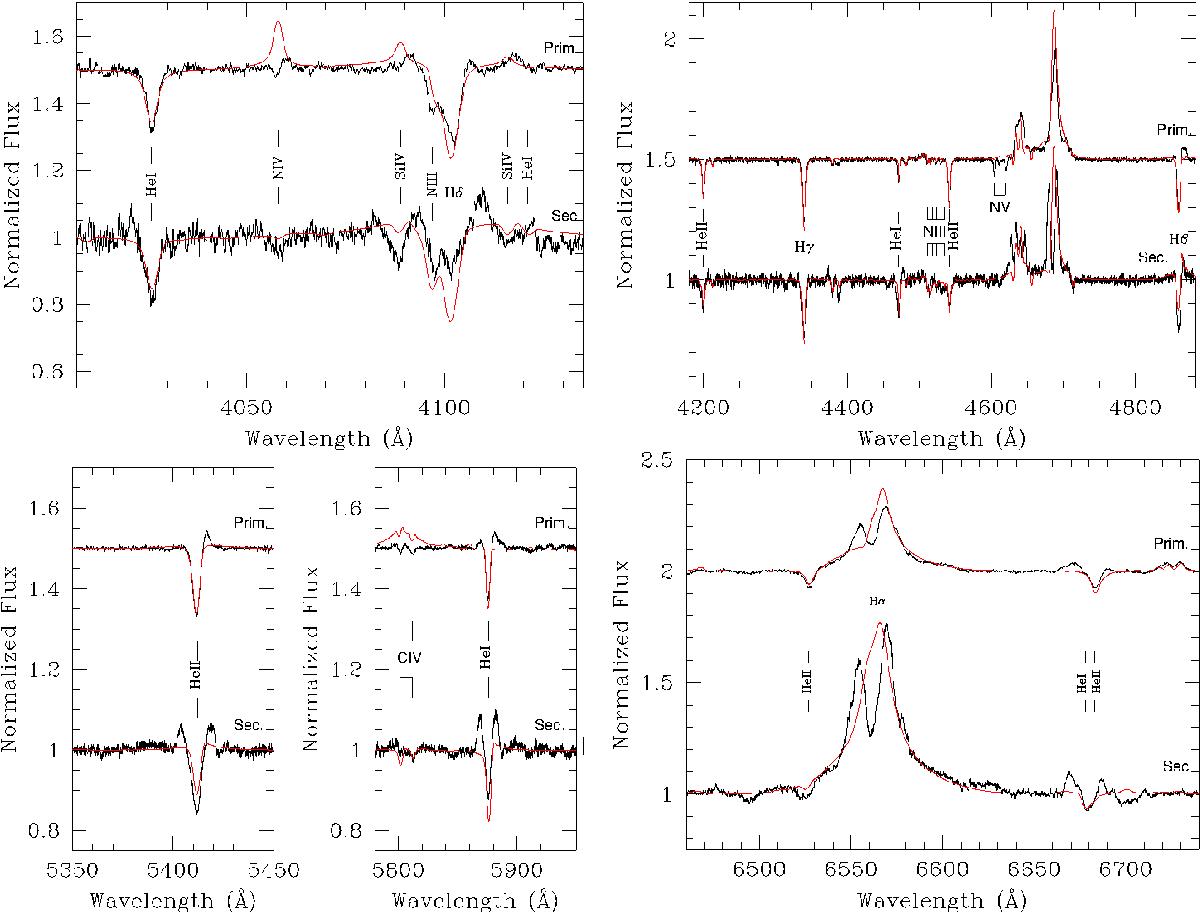
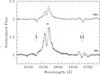
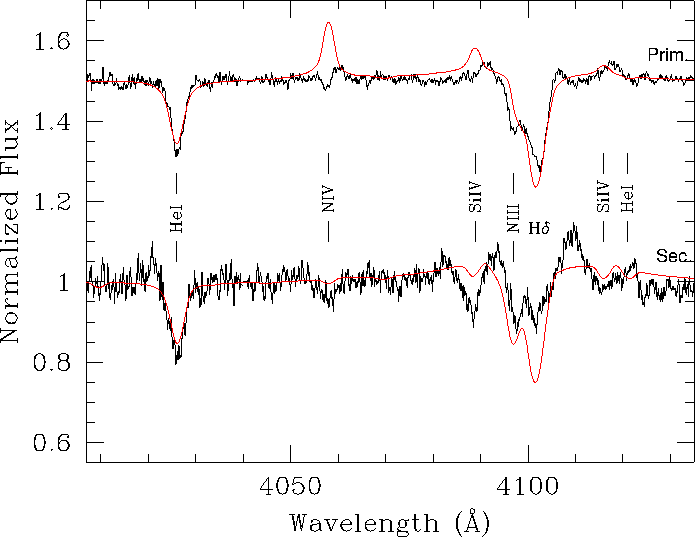
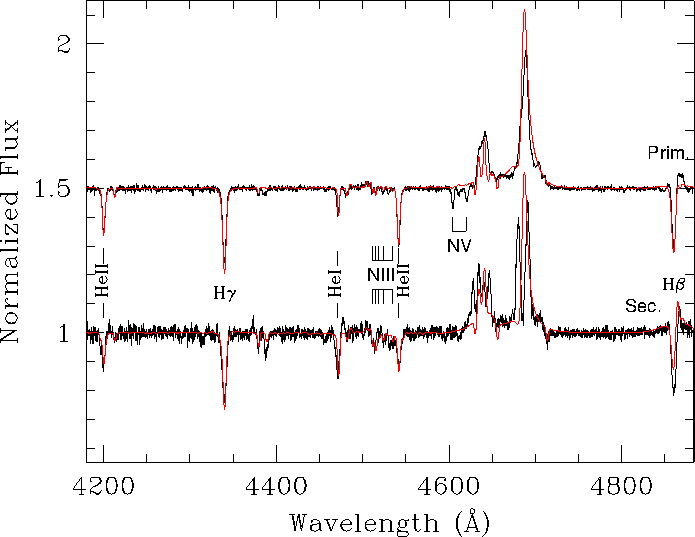
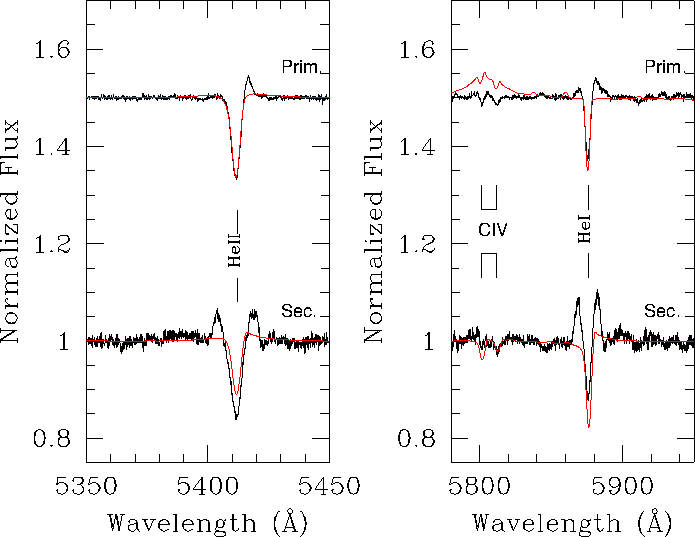
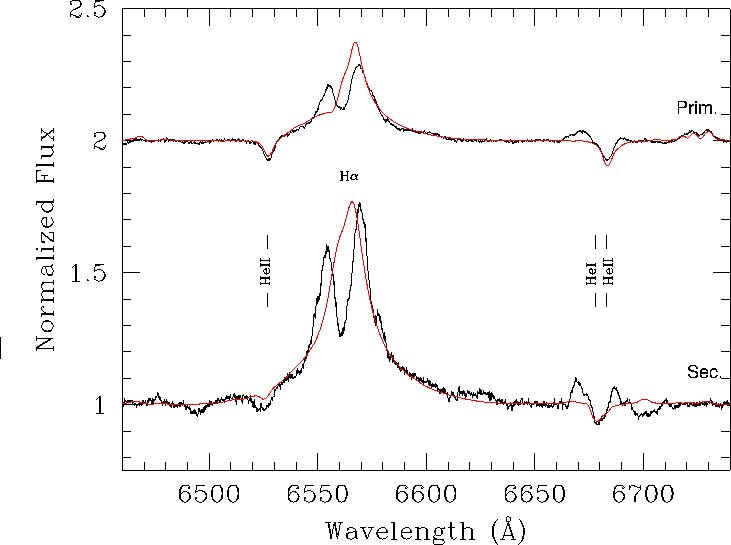
Part of the normalized separated spectra of the primary (top, shifted upwards by 0.5 continuum units in the first three panels, and by 1.0 continuum units for the last panel) and secondary stars (bottom), along with the best-fit CMFGEN model spectra (red).
This figure is made of several images, please see below:
Current usage metrics show cumulative count of Article Views (full-text article views including HTML views, PDF and ePub downloads, according to the available data) and Abstracts Views on Vision4Press platform.
Data correspond to usage on the plateform after 2015. The current usage metrics is available 48-96 hours after online publication and is updated daily on week days.
Initial download of the metrics may take a while.