Fig. 5
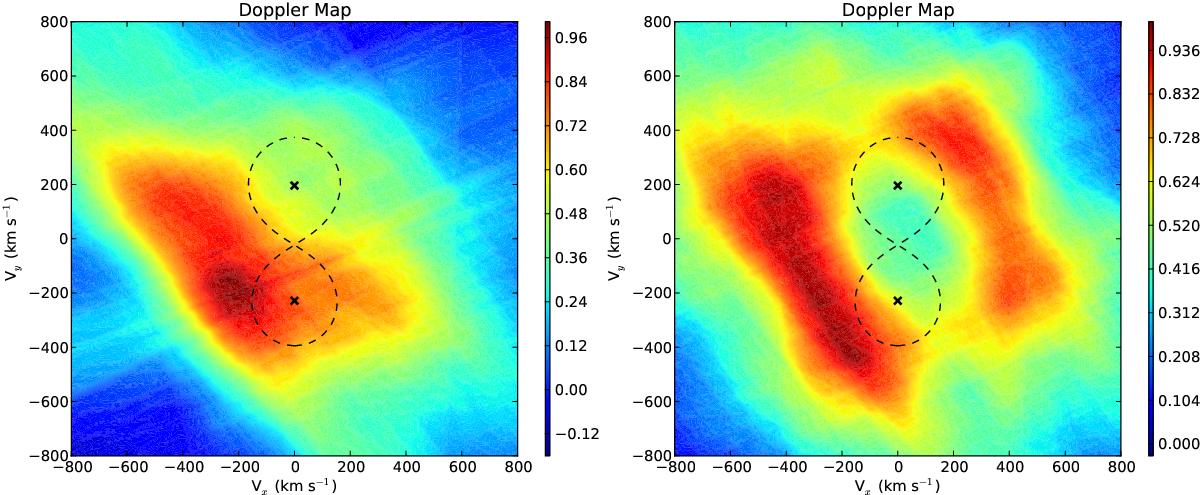
Doppler maps of the He ii λ 4686 (left) and Hα (right) emission lines in the spectrum of LSS 3074. The crosses correspond to the radial velocity amplitudes of the centre of mass of the primary (negative ![]() ) and secondary (positive vy), whereas the dashed lines indicate the Roche lobe in velocity space for a mass ratio m1/m2 = 0.86. The colour scale indicates the level of the line emissivity relative to its maximum value.
) and secondary (positive vy), whereas the dashed lines indicate the Roche lobe in velocity space for a mass ratio m1/m2 = 0.86. The colour scale indicates the level of the line emissivity relative to its maximum value.
Current usage metrics show cumulative count of Article Views (full-text article views including HTML views, PDF and ePub downloads, according to the available data) and Abstracts Views on Vision4Press platform.
Data correspond to usage on the plateform after 2015. The current usage metrics is available 48-96 hours after online publication and is updated daily on week days.
Initial download of the metrics may take a while.